Consumers shopping for homes on Trulia have three new color-coded interactive map features to help them get a feel for the potential for wildfires, hurricanes, tropical storms or tornadoes in U.S. cities in the lower 48 states.
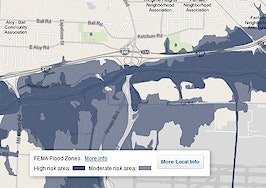
The three new hazard maps join two others — flood and earthquake — that Trulia released in May and are designed to help consumers and their agents “to better visualize what a place is like,” said Peter Black, Trulia’s lead geospatial engineer, who led the team of the three that designed the maps.
“After Hurricane Sandy hit we felt a personal connection and we decided to go through with the plan to build these maps,” Black told Inman News at Trulia headquarters in San Francisco Wednesday during a demo of the new hazard maps.
[fliqz id=”515ce4c18dd44bb3ba7f27069cab070c”]
Peter Black, Trulia’s lead geospatial engineer, introduces the new Trulia wildfire hazard map. (1:39)
The maps, which are built with public data and include a visualization of the magnitude, location and name of past events, reveal the likelihood of one of the natural events occurring in a specific location, based on historical fire and storm data from the U.S. Forest Service, the National Oceanic and Atmospheric Administration, and National Weather Service.
(Some states require that sellers disclose whether a home is in a hazard-prone area. California law, for example, requires that buyers be provided with Natural Hazard Disclosure Statements that identify risks including floods, wildfires and earthquakes. Trulia’s maps are not intended to be used to meet such legal requirements.)
The wildfire maps, which are built with Forest Service data going back to the year 2000 and updated once a year, show the potential for blazes by color-coding 270-square-meter grids across a spectrum from green to yellow to red. Users can filter fires by year, and see the name of the fire and the area affected on the map when they roll their cursor or finger over the fire’s outline.
The tornado maps, built with NOAA and National Weather Service data, use an “Enhanced Fujita Scale,” which shows accumulated wind energy from storms over the years, at a slightly larger resolution — hexagons that are 7 miles across. Using a slider, users can see tornado tracks by month of the year, with the size of the track indicating the power of the windstorm.
The hurricane maps incorporate 60-plus years of NOAA tropical storm and hurricane data, and, like the tornado maps, present the historical accumulated energy of those storms using “hexagonal binning.” The hexagons are colored deep purple for higher-energy locations, fading through six lighter shades to lavender in areas less susceptible to storms.
“We couldn’t find a good map for hurricanes when we first started,” Black said. The map was a challenge to design, he said. The data came in a “spaghetti mash of files.”
Now with flooding, earthquake, wildfire, hurricane and tornado hazard maps, Black said he suspects we have seen the last iteration of the Trulia hazard map. But, he said, there’s talk of building something like a climate map that could show the frequency and intensity of snow and ice storms or intensity of certain locales’ suffering in blazing heat.
Thanks to these maps, Trulia Chief Economist Jed Kolko can say with relative certainty that upstate New York and Ohio are home to some of the lowest-risk metros that exist in the U.S. and that people aren’t paying more to live in risk-averse places.
“The places that avoid disaster tend to be cheaper on average,” Kolko said.