New technology has made selling listings off the local multiple listing service easier than ever for agents. From Zillow’s “Coming Soon” listings to private Facebook groups to brokerage apps that encourage in-house deals, the MLS is not the only game in town.
Critics blame greed. They say agents and brokers want to collect both sides of a commission in a real estate transaction, regardless of what’s best for the buyer, the seller or the cooperation that underpins the industry. But has the double-ending of deals actually increased along with pocket listings?
To find out we asked for stats from four multiple listing services across the country representing some 127,000 real estate professionals: Rockville, Maryland-based Metropolitan Regional Information Systems Inc. (MRIS); Lisle, Illinois-based Midwest Real Estate Data LLC (MRED); the Houston Association of Realtors (HAR); and Silicon Valley-based MLSListings Inc.
In general, the data indicate that the share of deals that are double-ended, whether by the agent and broker or just the broker, has either declined or roughly plateaued in the years following the housing bust.
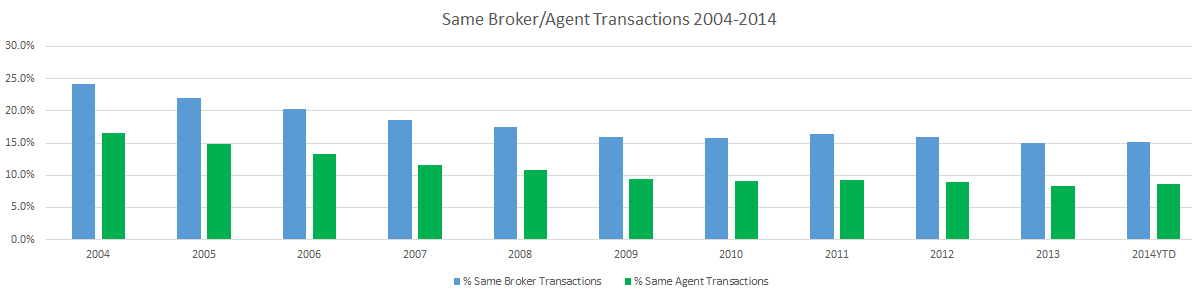
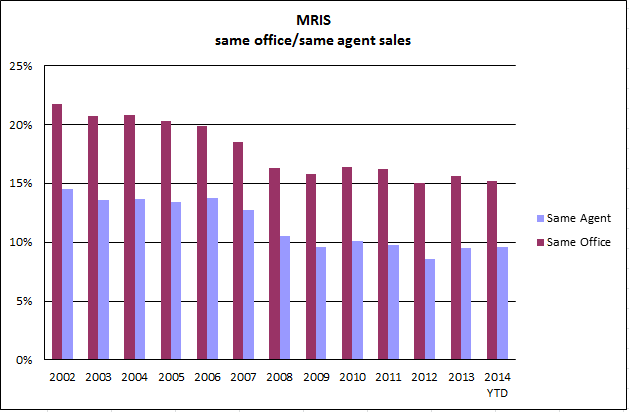
The share of double-ended deals varied by MLS: In 2013, 24 percent of MLSListings’ sold listings had the same broker on both sides; 11 percent were same-agent deals. For HAR, those numbers were 15 percent and 8.4 percent, respectively. Among MRIS’ sold listings in 2013, 15.6 percent were same-office deals and 9.5 percent were same-agent deals. For MRED, those figures were 13.5 percent and 7.3 percent, respectively.
Andrew Strauch, MRIS vice president of product innovation and marketing, believes the decrease in double-ended deals in MRIS’ coverage area from around 20 percent in the early 2000s to around 15 percent in recent years was due to a drop in the velocity of sales after the bottom fell out of the market.
“The market was crazy from 2002 to 2007. There were lots of sellers that wanted to sell (and) lots of buyers that wanted to buy resulting in more coincidental matches internal to a brokerage office that met the needs of the seller. When things quieted down agents had to look more broadly to find buyers,” Strauch said.
All things being equal, if an agent had an exact same offer from two different buyers, they were more likely to work with the buyer they were familiar with through their own firm, he said. After the bust, they were less likely to be able to find a buyer among their own ranks, he added.
An MRED spokesperson used similar reasoning to explain the decline in double-ended deals, saying that agents have had to work harder to match sellers and buyers, but attributed that challenge to tighter inventory.
“Years ago it was easier for one of an agent’s 10 buyers to buy the house of one of his or her 10 sellers. Now, it’s harder for one of that same agent’s 10 buyers to buy the house of one of his or her three sellers,” the spokesperson said.
“I think it becomes harder to keep a listing within your office because agents just don’t have as many listings. It’s all about the smaller inventory.”
It is worth noting that the opposite argument is often made: that tight inventory means that listing agents can have their pick of buyers and often choose one that will hook them both sides of the commission.
MRED doesn’t track off-MLS deals or “comp only” deals like some other MLSs do, so it is difficult to say what precisely the effect of pocket listings has been on double-ended deals in that market. Even in those that do keep track, it is unclear what the effect of listings kept completely off the MLS would be on this dual agency data.
Data from other MLSs does provide some clues. MRIS listings that sold within one day or the same day, which the MLS typically considers pocket listings, declined from 7.6 percent of transactions in 2005 to 4.3 percent in the first eight months of this year. Strauch considers 4 percent to be the long-term trend for pocket listings in the areas MRIS covers.
“There were definitely fewer listings going in the MLS (during the boom),” Strauch said.
“Comp only” data from both MRIS and MLSListings shows that listings excluded from the MLS but then entered into the MLS after they had been sold were considerably more likely to be doubled-ended by brokers than transactions overall, and were also double-ended by agents more often than not.
While the data hints at the behavior of agents holding listings off the MLS, “comp only” listings are a tiny percentage of overall transactions recorded in the MLS. It could be that the majority of pocket listings are not entered into the MLS even for comp purposes, and whether they were double-ended or not remains lost.
But most listings are still recorded in the MLS, and the rate at which those deals are double-ended is either going down or stabilizing. Another housing boom or a much more significant tech innovation than the current crop of tools could change that.
MLSListings Inc.:
Doubled-ended deals:
| Year | Number soldlistings SFR/C/T | Number Same Agent Both Sides | Percent Same Agent Both Sides | Same Broker Code Both Sides | Percent Same Broker Code Both Sides | Same Broker Code Different Agent | Percent Same Broker Code Different Agent |
| 2010 | 29,789 | 2,772 | 9% | 5,985 | 20% | 3215 | 11% |
| 2011 | 30,207 | 2,626 | 9% | 5,924 | 20% | 3298 | 11% |
| 2012 | 32,374 | 2,991 | 9% | 7,106 | 22% | 4115 | 13% |
| 2013 | 30,839 | 3,304 | 11% | 7,389 | 24% | 4085 | 13% |
| 2014 YTD | 19,492 | 1,849 | 9% | 4,115 | 21% | 2266 | 12% |
YTD= Through Sep. 4, 2014
Note from MLSListings: For the double-ending info, we matched purely on license number and broker code. We do accommodate teams; however, we did not delve into that analysis for this data pull.
Comp-only double-ended deals:
| Comp-Only Total Double-End | Comp Only Same Agent Double-End | Comp Only Same Agent Double-End (%) | Comp Only Same Broker Double End | Comp Only Same Broker Double End (%) | Comp Only Same Broker Different Agent Double End | Comp Only Same Broker Different Agent Double End (%) | |
| 2010 | 146 | 43 | 29% | 68 | 47% | 25 | 17% |
| 2011 | 161 | 47 | 29% | 85 | 53% | 38 | 24% |
| 2012 | 300 | 92 | 31% | 152 | 51% | 60 | 20% |
| 2013 | 377 | 119 | 32% | 230 | 61% | 111 | 29% |
| 2014 YTD | 261 | 79 | 30% | 135 | 52% | 56 | 21% |
Note from MLSListings: We do allow agents to enter comp-only deals, but only if the property was properly excluded by having the seller sign our exclusion form and then turning that form in to our compliance team. If the property was not excluded through our exclusion filing process, it is not able to be added to the system as a comp.YTD = Through Sep. 11, 2014
Off-MLS deals:
| Year | Percent Sold Off-MLS |
| 2012 | 13.63% |
| 2013 | 20.69% |
| 2014 (Q1-Q2) | 17.07% |
Off-MLS deals from Jan. 1-June 30, 2014:
| County | Number of Sales | Number Sold on MLS | Number Not Sold on MLS | Percent Sold Off-MLS | Sales Volume Sold Off-MLS |
| Monterey | 1,547 | 1,255 | 292 | 18.88% | $190,234,300 |
| San Benito | 282 | 243 | 39 | 13.83% | $12,435,437 |
| San Mateo | 3,428 | 2,835 | 593 | 17.30% | $564,778,581 |
| Santa Clara | 8,330 | 6,903 | 1,427 | 17.13% | $1,075,529,439 |
| Santa Cruz | 1,178 | 1,008 | 170 | 14.43% | $78,081,091 |
| ALL 5 Counties | 14,765 | 12,244 | 2,521 | 17.07% | $1,921,058,848 |
Midwest Real Estate Data LLC (MRED):
Double-ended deals:
| Time Period | # Closed Transactions | # Doublesided by Agent | 0% | # Doublesided within Office | 0% | Avg. MSI |
| Q2 2014 | 33,633 | 2,259 | 6.70% | 4,267 | 12.70% | 3.5 |
| Q1 2014 | 21,584 | 1,546 | 7.20% | 2,767 | 12.80% | 4.5 |
| Q1 – Q2 2014 | 55,217 | 3,805 | 6.90% | 7,034 | 12.70% | 4 |
| Q1 – Q2 2013 | 58,381 | 4,231 | 7.20% | 7,904 | 13.50% | 4.5 |
| Q1 – Q2 2012 | 46,051 | 3,824 | 8.30% | 6,905 | 15.00% | 7.7 |
| Q1 – Q2 2011 | 37,791 | 3,368 | 8.90% | 6,041 | 16.00% | 11.9 |
| Q1 – Q2 2010 | 44,365 | 3,957 | 8.90% | 6,915 | 15.60% | 12.8 |
| Q1 – Q2 2009 | 32,332 | 3,188 | 9.90% | 5,363 | 16.60% | 15.5 |
| Q1 – Q4 2013 | 125,114 | 9,113 | 7.30% | 16,907 | 13.50% | 4.9 |
| Q1 – Q4 2012 | 101,239 | 8,236 | 8.10% | 14,856 | 14.70% | 7.4 |
| Q1 – Q4 2011 | 80,452 | 7,087 | 8.80% | 12,762 | 15.90% | 11.9 |
| Q1 – Q4 2010 | 80,544 | 7,579 | 9.40% | 13,142 | 16.30% | 14.6 |
| Q1 – Q4 2009 | 79,637 | 7,549 | 9.50% | 12,742 | 16.00% | 14.3 |
Note: “Double-sided within office” does not account for deals that were double-sided by agents in the same brokerage firm but in different offices.
Months supply of inventory:

Houston Association of Realtors:
Double-ended deals:
| 2004 | 2005 | 2006 | 2007 | 2008 | 2009 | 2010 | 2011 | 2012 | 2013 | 2014 YTD | |
| % Same Broker Transactions | 24.2% | 22.0% | 20.3% | 18.5% | 17.4% | 16.0% | 15.8% | 16.4% | 16.0% | 15.0% | 15.1% |
| Total Transactions | 59658 | 65179 | 72441 | 69882 | 58780 | 54614 | 51681 | 53830 | 62695 | 73721 | 49409 |
| Coop Transaction | 14437 | 14363 | 14684 | 12963 | 10248 | 8738 | 8165 | 8828 | 10031 | 11058 | 7455 |
| Same Agent | 9917 | 9644 | 9610 | 8131 | 6360 | 5157 | 4693 | 4999 | 5571 | 6166 | 4247 |
| % Same Agent Transactions | 16.6% | 14.8% | 13.3% | 11.6% | 10.8% | 9.4% | 9.1% | 9.3% | 8.9% | 8.4% | 8.6% |
Metropolitan Regional Information Systems Inc. (MRIS):
Residential Sales
| Year | Total Transactions* | Units Sold | Units Sold Same Office | % of Total Units Sold | Units Sold Same Agent | % of Total Units Sold |
| 2014 YTD** | 157,248 | 78,624 | 11,977 | 15.20% | 7,561 | 9.60% |
| 2013 | 240,196 | 120,098 | 18,748 | 15.60% | 11,420 | 9.50% |
| 2012 | 200,422 | 100,211 | 15,101 | 15.10% | 8,616 | 8.60% |
| 2011 | 201,802 | 100,901 | 16,373 | 16.20% | 9,894 | 9.80% |
| 2010 | 208,826 | 104,413 | 17,118 | 16.40% | 10,524 | 10.10% |
| 2009 | 214,240 | 107,120 | 16,943 | 15.80% | 10,261 | 9.60% |
| 2008 | 196,934 | 98,467 | 16,033 | 16.30% | 10,391 | 10.60% |
| 2007 | 226,054 | 113,027 | 20,935 | 18.50% | 14,439 | 12.80% |
| 2006 | 283,396 | 141,698 | 28,147 | 19.90% | 19,565 | 13.80% |
| 2005 | 362,088 | 181,044 | 36,768 | 20.30% | 24,383 | 13.50% |
| 2004 | 361,850 | 180,925 | 37,612 | 20.80% | 24,795 | 13.70% |
| 2003 | 325,300 | 162,650 | 33,764 | 20.80% | 22,149 | 13.60% |
| 2002 | 302,486 | 151,243 | 32,883 | 21.70% | 21,986 | 14.50% |
Notes: * Transactions are one side of the sale. Total Units Sold would be half of Total Transactions. ** 2014 Sales are through Aug. 31, 2014
Note from MRIS: For listings that had days on market of 0 and 1 day, which we typically believe are pocket listings, we have the following numbers:
| 2014 YTD: 4.3% |
| 2013: 4.4% |
| 2011: 2.8% |
| 2009: 2.9% |
| 2007: 3.0% |
| 2005: 7.6% |
Comps-only double-ended deals:
| Year | Total TransactionsComps Only* | Total Comps | Units Sold Same Office | % of Total Units Sold | Units Sold Same Agent | % of Total Units Sold |
| 2014 YTD** | 3,144 | 1,572 | 461 | 29.30% | 402 | 25.60% |
| 2013 | 6,054 | 3,027 | 786 | 26.00% | 656 | 21.70% |
| 2012 | 5,034 | 2,517 | 665 | 26.40% | 544 | 21.60% |
| 2011 | 4,158 | 2,079 | 549 | 26.40% | 475 | 22.80% |
| 2010 | 4,410 | 2,205 | 533 | 24.20% | 471 | 21.40% |
| 2009 | 4,320 | 2,160 | 620 | 28.70% | 562 | 26.00% |
| 2008 | 4,130 | 2,065 | 484 | 23.40% | 451 | 21.80% |
| 2007 | 5,834 | 2,917 | 681 | 23.30% | 627 | 21.50% |
| 2006 | 8,180 | 4,090 | 862 | 21.10% | 784 | 19.20% |
| 2005 | 102 | 51 | 13 | 25.50% | 13 | 25.50% |
Notes: * Transactions are one side of the sale. Total Units Sold would be half of Total Transactions. ** 2014 Sales are through Sept. 30, 2014
From MRIS: As it relates to comps, we don’t have reliable data prior to 2006. At that time MRIS made changes to its system to provide for the tracking of listings entered for comparable data. “Comps only” is a term used for agents to enter sales of properties not in MRIS. A comp is submitted after settlement.