
How Is The Market is a real estate listing trends and analysis tool for supporting pricing models developed by a top-producing broker at ERA.
Have suggestions for products that you’d like to see reviewed by our real estate technology expert? Email Craig Rowe.
How Is The Market is market analytics and trends reporting tool for agents and their clients.
Platforms: Browser-based
Ideal for: All agents
Top selling points
- A new way to support listing price recommendations
- Uses existing MLS statistics
- Easy to demonstrate to buyers and sellers
- Good support tool for listing presentations
Top concerns
This is a numbers-lover’s tool, using graphs and tables. It may turn off more established agents with long-standing approaches to setting prices.
What you should know
How Is The Market was inspired by that very question, a query heard by agents multiple times a day.
Developer Todd Beckstrom created it for himself, believing that if real estate is a true market, then comparative sales and appraisals aren’t viable ways to price a home.
He believes a true market is defined by supply and demand dynamics, so he created spreadsheet-based solution to give agents a new way to explain pricing.
How Is The Market is a web-based calculator that uses expected price ranges to predict the probability of a sale within that range based on every stat that contributed to a sale in the last 12 months.
This is a numbers-lover’s tool.
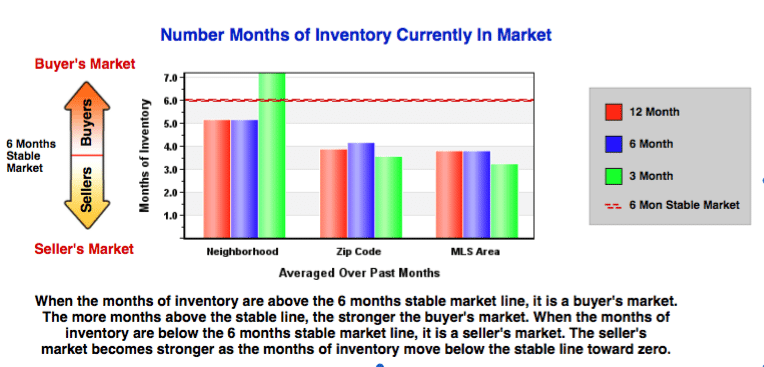
That probability is broken down further by neighborhood, ZIP code, and the entire MLS. This gives sellers and buyers a chance to see how their home stacks up against the rest of the market as well as those merely a few blocks away.
Agents plug in different sales price scenarios to reach a probability percentage that is both reasonable and agreeable.

It also uses “Sales Velocity” metrics to offer number of homes sold and a graph that shows when trends are shifting from a buyer’s market to a seller’s market, or vice versa, even in particular communities.
Absorption Rate and Flow Rate, or a ratio of closed versus total available properties, also back the How Is The Market property report.
Beckstrom is a top-producing agent with The Todd Beckstrom All-Star Team of ERA Wilder Realty. He told me he’s successfully negotiated with appraisers using his patent-pending formulas, and that they’re a big reason for his sales record.
Beckstrom is also a speaker for the National Association of Realtors and told me that the organization wanted to license his product.
Completed property reports are produced as PDFs and can be branded to individual agents.

Once all together, after about a 15-minute process, reports are easy to digest and dare I say, fun to peruse.
A lot of information can be extrapolated from them, and I find the data a great deal more intriguing and, ultimately, more justifiable than a simple MLS-generated comp report, especially when it comes to standing on a price recommendation.
How Is The Market reports look good, and are suitable for listing presentations. Remember, this is a stats and charts tool: It’s about housing numbers and positioning the agent as the expert.
In that respect, I think this is a worthwhile tool that can bring some tough-to-swallow transparency to your customers.
Have a technology product you would like to discuss? Email Craig Rowe


Comments