
Are you willing to pay a lower rent to live in an area more prone to earthquakes and floods?
Three new map tools from Trulia — one that tracks rents and two others that track the likely severity of earthquakes and floods at the neighborhood level — will allow home shoppers to visualize the answer to just that question for any neighorhood in the U.S.
The new heat maps, which track the rental cost-per-bedroom and the likelihood of an earthquake or flood using U.S. Geological Survey and Federal Emergency Management Agency data, join Trulia’s suite of map visualizations, which also include home values, crime, school rankings, commute times and local amenities.
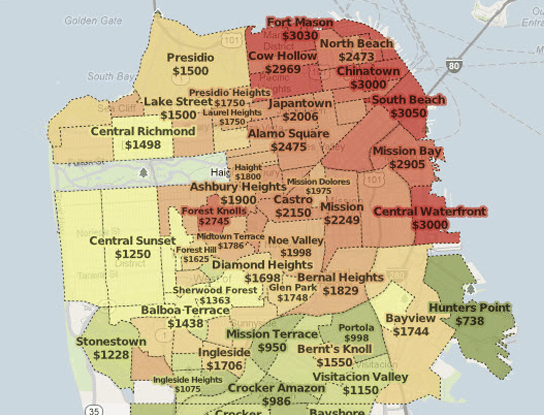
Screen shot of Trulia’s new rental price map visualization tool applied to San Francisco.
“At Trulia, we use interactive map visualizations to present large amounts of information in an easy-to-understand format,” said Lee Clancy, vice president of consumer products at Trulia in a statement. “With our new rental maps, consumers can browse through color-coded neighborhoods and quickly focus their search on neighborhoods that meet their budget.”
“After considerable damage in recent years, many consumers likely feel as if the frequency and severity of natural disasters is increasing across the United States, but up until now the risk of these events has traditionally been hard for homebuyers, sellers and renters to find,” Clancy said. “Now house hunters can use our maps to see flood zones and understand where earthquakes are more common in order to make informed decisions about where to move.”
The new heat maps, also available to users of Trulia’s Android app, can be accessed here.

Screen shot of Trulia’s new flood risk map visualization applied to lower Manhattan in New York City and surrounding area.