
Check Inman every day for the daily version of this market roundup.
Weekly mortgage rates:
Powered by MortgageCalculator.org
Powered by MortgageCalculator.org
Thursday, Oct. 8:
RealtyTrac’s U.S. Zombie Foreclosure and Vacant Property Report:
- A “zombie foreclosure” happens when a homeowner moves out of the home after foreclosure proceedings have started, but then the foreclosure is held up in some way or canceled, leaving the title in the homeowner’s name.
- This phenomenon is on the decline. A RealtyTrac report shows that 20,050 properties were vacant zombie homes at the end of the third quarter.
- That’s a decrease of 27 percent since the second quarter, and 43 percent from the same quarter last year.

Wednesday, Oct. 7:
Mortgage Bankers Association’s weekly applications survey:
- The Market Composite Index, which measures mortgage loan application volume, increased 25.5 percent week-over-week on a seasonally adjusted basis. (It increased 26 percent on an unadjusted basis.)
- The Refinance Index increased 24 percent week-over-week.
- The seasonally adjusted Purchase Index increased 27 percent week-over-week.
Fannie Mae’s Home Purchase Sentiment Index:
- The index increased to 3 points to 83.8 in September.
- The share of respondents who said it is a good time to buy a house increased 1 percentage point to 64 percent.
- The share of respondents who say it is a good time to sell increased 5 percentage points to 52 percent.

Tuesday, Oct. 6:
The Mortgage Credit Availability Index (MCAI) for September 2015:
- Mortgage credit availability increased in September.
- The MCAI increased 0.3 percent month-over-month to 126.5. (It was benchmarked to 100 in March 2012.)
- The Conventional MCAI was up 1.1 percent month-over-month, followed by the Conforming MCAI (up 0.8 percent).

CoreLogic’s August 2015 Home Price Index:
- Home prices increased 1.2 percent month-over-month in August 2015.
- They increased 6.9 percent year-over-year.
- CoreLogic’s forecast projects a 4.3 percent increase year-over-year in August 2016.

Monday, Oct. 5:
WalletHub’s most and least energy-efficient states:
- New York, Vermont and Minnesota were the most energy-efficient states.
- Texas, Louisiana and South Carolina were the least energy-efficient states.
- WalletHub measured the consumption of home and car energy in 48 states; Alaska and Hawaii were excluded from this analysis.
Source: WalletHub
Livability’s 10 Best Cities for Singles:
- Carrboro, North Carolina; Hoboken, New Jersey; West Hollywood, California were the top three cities for singles.
- Oxford, Mississippi; San Marcos, Texas; Ypsilanti, Michigan; and Ames, Iowa were ranked 4 through 7.
- Miami Beach, Florida; Athens, Georgia; and Moscow, Idaho took spots 8 through 10.
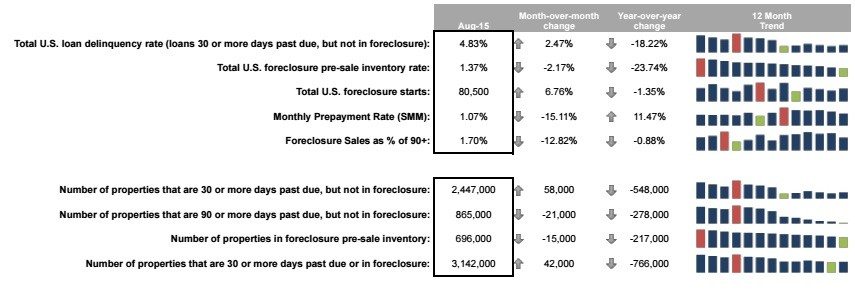
Black Knight Financial Services’ August Mortgage Monitor Report:
- Cash-out refinances were up 68 percent year-over-year in August 2015.
- The average borrower was tapping $67,000 in equity.
- Though they’re at the highest volume since 2010, cash-out refinances were still almost 80 percent below 2005 peak levels.
Email market updates to press@inman.com.
You have {{data.cm.viewsLeft}} articles left this month.
This content is available to Inman Select subscribers.
Please select an option below.
Please register to access this content.
To continue viewing the content you love, please sign in or create a new account
You have used all of your free pageviews.
Please subscribe to access more content.
Access denied!