
We’ll add more market news briefs throughout the day. Check back to read the latest.
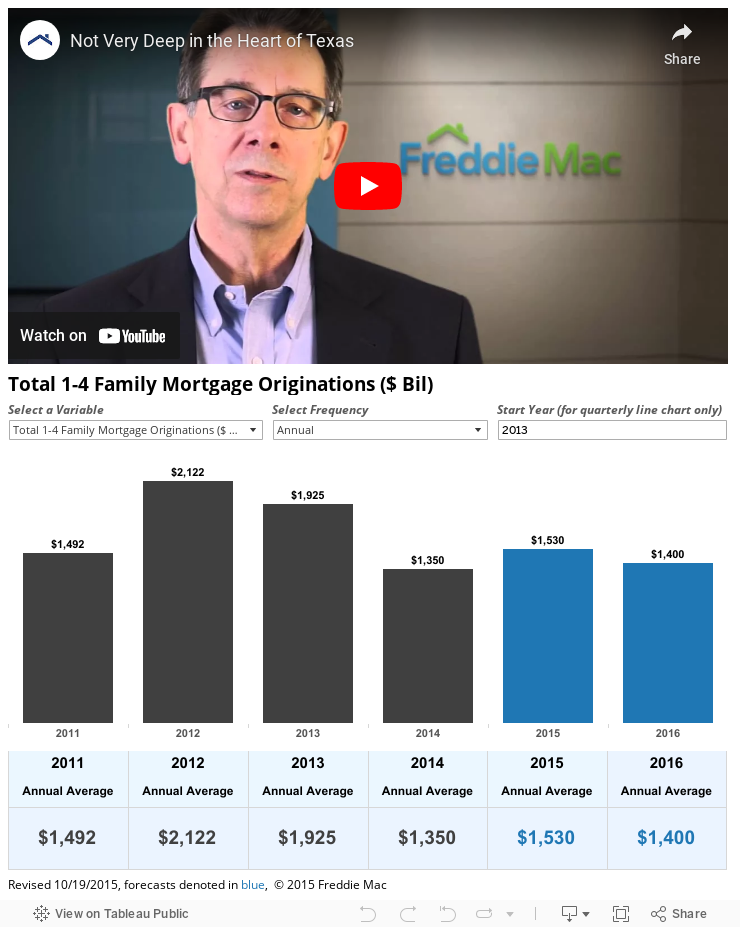
Freddie Mac’s October 2015 Insight & Outlook:
- Origination volume was $100 billion higher in 2014 than industry experts had estimated.
- Industry concentration is declining: The top five mortgage loan firms accounted for only 34 percent of the market in 2014.
- The projected refinance share of originations in 2015 has been lowered by 1 percentage point to 47 percent.
- Sales of new single-family homes in September 2015 were down 11.5 percent month-over-month.
- However, sales were up 2.0 percent year-over-year.
- The median sales price of new houses sold in September 2015 was $296,900; the average sales price was $364,100.
Homes.com’s Local Market Index for August 2015:
- Boise (Idaho), San Francisco and Denver saw the biggest year-over-year index point increases in August 2015.
- Dallas/Fort Worth/Arlington, Denver/Aurora/Lakewood and Austin/Round Rock were cited as top markets in the “rebound report.”
- Bottom markets for rebounding: Las Vegas/Henderson/Paradise, Stockton/Lodi (California) and Cape Coral/Fort Myers.

Black Knight’s August 2015 home price data:
- August home prices were up 0.3 percent month-over-month.
- Prices are up 5.5 percent year-over-year.
- The current home price index value, according to Black Knight: $253,000.

Mortgage rates:
[graphiq id=”b2w6fmfIyNL” title=”30-Year Fixed Rate Mortgage Rates for the Past 6 Months” width=”600″ height=”400″ url=”https://w.graphiq.com/w/b2w6fmfIyNL” link=”http://mortgage-lenders.credio.com” link_text=”30-Year Fixed Rate Mortgage Rates for the Past 6 Months | Credio”]
[graphiq id=”2NvK9Bl9HIF” title=”15-Year Fixed Rate Mortgage Rates for the Past 6 Months” width=”600″ height=”400″ url=”https://w.graphiq.com/w/2NvK9Bl9HIF” link=”http://mortgage-lenders.credio.com” link_text=”15-Year Fixed Rate Mortgage Rates for the Past 6 Months | Credio”]
Home equity rates:
[graphiq id=”kPkTJrAnX5r” title=”Average Home Equity Loan Bank Rates by State” width=”600″ height=”465″ url=”https://w.graphiq.com/w/kPkTJrAnX5r” link=”http://mortgage-lenders.credio.com” link_text=”Average Home Equity Loan Bank Rates by State | Credio”]
[graphiq id=”dP0v3iYOnH” title=”Average Home Equity Loan Credit Union Rates by State” width=”600″ height=”465″ url=”https://w.graphiq.com/w/dP0v3iYOnH” link=”http://mortgage-lenders.credio.com” link_text=”Average Home Equity Loan Credit Union Rates by State | Credio”]
Last week’s most recent market news:
CoreLogic’s July 2015 cash sale shares:
- Cash sales comprised 30.8 percent of total home sales in July 2015, down from 34.2 percent in July 2014.
- Month-over-month, the share of cash sales fell by 0.5 percentage points.
- Prior to the housing crisis, the cash sales share of total home sales was about 25 percent; CoreLogic estimates if the share continues to fall, it should hit 25 percent by mid-2017.

Black Knight Financial Services’ “first look” at September 2015 mortgage data:
- The mortgage delinquency rate was up 1.7 percent month-over-month in September 2015.
- Overall non-current inventory (with loans 30 or more days past due or in foreclosure) is 3.2 million.
- Foreclosure and 90-day delinquent inventories continue to improve despite rise in delinquency rate.

Campbell/Inside Mortgage Finance HousingPulse Tracking Survey:
- Prices on non-distressed properties hit $296,700 in September 2015.
- Prices on non-distressed properties were up 8.6 percent year-over-year in September.
- The average sale-to-list price ratio for non-distressed properties was 97.8 percent in September, up from 97.5 percent in September 2014.
Send market reports to press@inman.com.