
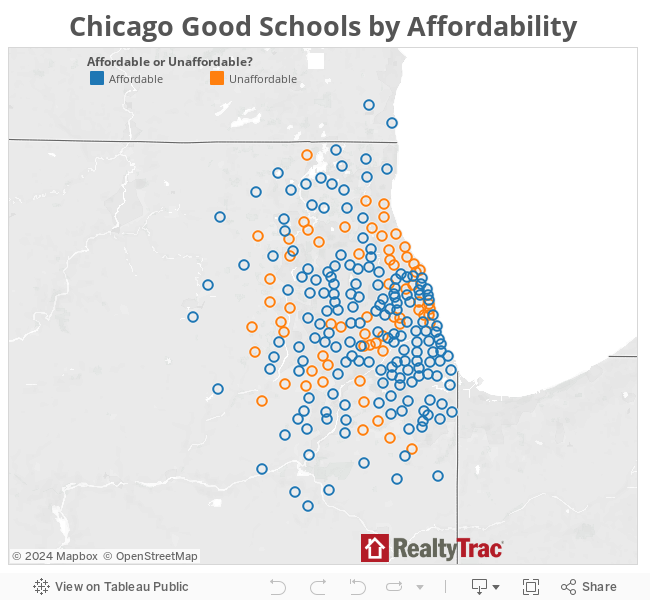
A RealtyTrac analysis of home affordability in communities with good elementary schools bodes well for Chicagoland homeowners.
For most of the rest of the country, though, many parents who seek out good school districts will likely be priced out of those markets. And although Chicago takes the top spot for the greatest number of affordable ZIP codes with at least one good school, the region also makes an appearance on the unaffordable segment of the list.
RealtyTrac used school test scores for nearly 27,000 elementary schools in more than 7,200 U.S. ZIP codes to determine what makes a “good school.” They then compared home price affordability in those same ZIP codes.
Chicagoland, or south side community of Harvey to be exact, far and away led the pack of metros with enviable combination of affordable ZIP codes with good elementary schools, with 179. Next in line were Detroit (44), Phoenix (22), Miami (20) and Charlotte (18).
Chicagoland also appears on the least affordable list, with Glencoe appearing high on the list. The least affordable/good school combo is most prevalent in Los Angeles, with 184 zip codes meeting that criteria, followed by New York with 158, San Francisco at 77, Chicago showing 58 and finally San Diego with 49.
For the most part, the unaffordable districts are clustered around the West Coast, with a few scattered along the East Coast and Florida. The ZIP codes that fared best in this study are clustered inland.
The big picture result was that out of 1,823 zip codes that had at least one good school, 1,192 of those zip codes, or 65 percent, were out of reach for the average wage earner.
Median price data is from publicly recorded sales deeds and mortgages for single-family homes and condos. Only ZIP codes with at least 50 sales of single-family homes and condos in both 2014 and 2015 were included in the analysis. In some non-disclosure states, RealtyTrac used loan amounts and estimated property value at time of sale instead of the sale price.
Average wage data was for the first quarter of 2015, and came from the Bureau of Labor Statistics. Affordability was calculated based on the percentage of average wages to make monthly house payments on a median priced home, assuming a 10 percent down payment and 3.8 percent interest rate.
School data is from 2014 from each state’s Department of Education. Test scores are based around the test average of each state with the state average being a score of 1. The higher above the state average the school is, the higher the grade.