
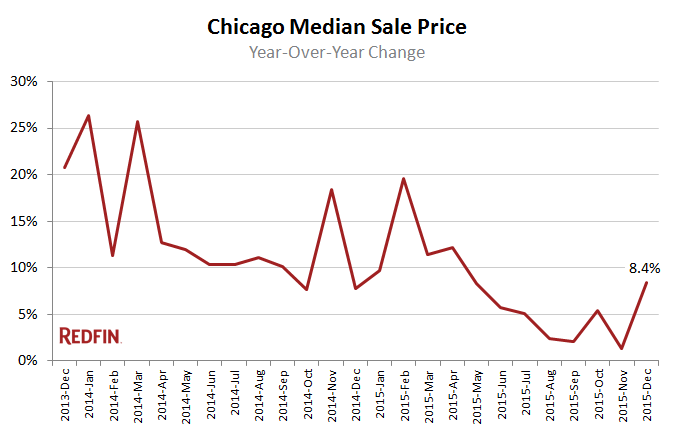
Chicagoans are dealing with the severe lack of inventory that is the lowest its been in the past decade. This December home prices were up 8.4 percent on an annual basis, but despite the mild winter home sales fell 2.8 percent, according to Redfin.
Chicago home prices began to fall back in February 2015, and although prices went through a couple of boosts, they have generally remained flat.
The lack of available homes pushed prices up for Chicagoland homeowners, with nine-straight months of declining numbers of homes on the market.

Chicago neighborhoods are all performing on different planes, and while some areas like Pullman are gaining speed, others are losing some traction. The popular family-friendly Lincoln Square saw a 29.8 percent dip in homes sold, however that could be impacted by the mere 33 homes for sale.
West Loop is still a reigning champion with more home sales and increasing prices, while only by a sliver. On the west side, Ukrainian Village saw a whopping 25.4 percent home value increase with dwindling inventory.
| Area | Median Sale Price | Year-Over-Year | Homes Sold | Year-Over-Year | Inventory | Year-Over-Year | New Listings |
|---|---|---|---|---|---|---|---|
| Albany Park | $253,500 | 25.5% | 102 | 20.0% | 160 | -10.1% | 99 |
| Andersonville | $391,000 | -1.0% | 42 | 13.5% | 64 | -8.6% | 45 |
| Archer Heights | $178,900 | 12.9% | 28 | 0.0% | 35 | 34.6% | 30 |
| Austin | $85,000 | 9.7% | 117 | -5.6% | 255 | -9.6% | 190 |
| Avondale | $295,000 | -7.7% | 87 | -12.1% | 130 | -11.0% | 102 |
| Beverly | $250,662 | -7.2% | 52 | 18.2% | 120 | 13.2% | 79 |
| Bridgeport | $345,000 | 30.7% | 57 | -13.6% | 101 | -3.8% | 66 |
| Brighton Park | $143,500 | 13.9% | 61 | 24.5% | 79 | 21.5% | 57 |
| Bucktown | $569,500 | 15.8% | 76 | 5.6% | 72 | -20.9% | 76 |
| Clearing | $182,500 | 15.5% | 66 | -7.0% | 127 | 15.5% | 88 |
| Edgewater | $227,500 | 16.7% | 158 | 12.1% | 294 | -3.6% | 188 |
| Edison Park | $259,000 | -13.5% | 36 | 5.9% | 59 | -10.6% | 34 |
| Englewood | $20,000 | 5.3% | 39 | 14.7% | 181 | -17.4% | 91 |
| Garfield Ridge | $190,000 | 0.5% | 89 | -8.2% | 143 | -6.5% | 110 |
| Gold Coast | $287,000 | -1.9% | 138 | 4.5% | 284 | -6.0% | 171 |
| Humboldt Park | $221,500 | 18.2% | 154 | 6.9% | 258 | -1.1% | 195 |
| Hyde Park | $145,000 | -15.9% | 64 | 56.1% | 143 | -34.1% | 61 |
| Irving Park | $294,750 | 4.2% | 112 | -6.7% | 254 | 11.9% | 194 |
| Jefferson Park | $262,000 | 6.5% | 78 | -1.3% | 107 | -5.3% | 83 |
| Kenwood | $151,000 | 1.6% | 39 | -7.1% | 120 | -13.7% | 61 |
| Lincoln Park | $537,000 | 10.7% | 288 | -9.4% | 477 | -6.7% | 366 |
| Lincoln Square | $359,000 | 6.1% | 33 | -29.8% | 119 | 25.3% | 66 |
| Logan Square | $365,000 | 28.6% | 156 | 10.6% | 177 | -8.8% | 179 |
| McKinley Park | $166,450 | -0.3% | 26 | 36.8% | 44 | -6.4% | 30 |
| Montclare | $225,200 | 21.3% | 37 | -5.1% | 44 | -34.3% | 34 |
| Mount Greenwood | $193,000 | -7.7% | 44 | -13.7% | 76 | 0.0% | 55 |
| Near North Side | $403,531 | 3.1% | 568 | 7.8% | 1,083 | -0.8% | 661 |
| North Center | $475,000 | -15.8% | 71 | 42.0% | 94 | 1.1% | 81 |
| Old Town | $317,500 | -5.9% | 89 | 2.3% | 112 | -5.1% | 96 |
| Portage Park | $252,500 | 2.4% | 149 | -8.0% | 255 | 14.3% | 177 |
| Pullman | $87,000 | 117.5% | 19 | 0.0% | 29 | -31.0% | 22 |
| Ravenswood | $337,500 | -26.1% | 64 | 36.2% | 73 | 7.4% | 53 |
| Rogers Park | $164,700 | 7.5% | 108 | 1.9% | 237 | 11.3% | 143 |
| Roscoe Village | $535,000 | -0.9% | 67 | -17.3% | 120 | 36.4% | 111 |
| Sauganash | $405,000 | 26.0% | 32 | 33.3% | 73 | 58.7% | 50 |
| South Lawndale / Little Village | $99,000 | 23.8% | 40 | 17.6% | 81 | -5.8% | 56 |
| South Loop | $349,000 | -0.3% | 235 | 0.4% | 355 | 4.1% | 267 |
| South Shore | $60,977 | 34.0% | 85 | -18.3% | 258 | -17.6% | 122 |
| Streeterville | $490,000 | 16.0% | 131 | -13.2% | 320 | -10.1% | 159 |
| The Loop | $345,000 | -5.5% | 185 | 9.5% | 324 | -0.9% | 211 |
| Tri-Taylor | $248,000 | 70.1% | 15 | 36.4% | 28 | -24.3% | 15 |
| Ukrainian Village | $542,500 | 25.4% | 20 | -23.1% | 34 | -19.0% | 26 |
| Uptown | $233,500 | 15.9% | 142 | -6.6% | 270 | -23.5% | 172 |
| West Loop | $365,000 | 1.1% | 137 | 12.3% | 111 | -17.2% | 117 |
| West Town | $457,750 | 5.2% | 341 | -0.9% | 425 | -12.6% | 412 |
| Wicker Park | $480,300 | 0.7% | 105 | -6.3% | 122 | -17.6% | 118 |
| Chicago | $237,250 | 8.4% | 2,350 | -2.8% | 10,645 | -6.9% | 2,163 |