
First American Financial Corporation released the Real House Price Index (RHPI) for homes in America, tracing data back to 2000 to measure home prices and affordability based on adjusted income and changing interest rates.
The findings? America’s RHPI is currently 39.6 percent lower than it was during the pre-recession peak in 2006.
The RHPI is driven by three factors; income, mortgage rates and an unadjusted house price index. The incomes and mortgage rates are used to inflate or deflate the unadjusted house prices to determine consumer purchase power and obtain a truer cost of housing to consumers.
First American’s Chief Economist Mark Fleming wrote in the report that although house prices are reported, they are only reported as numbers. Out of context, or without adjusting for inflation, the nominal price of homes cannot represent the true cost without taking inflation into consideration.
In other words, “the price of a house today is not directly comparable to the price of that same house 30 years ago because of the long-run influence of inflation in the economy,” Fleming wrote in the report.

An example contrasting RHPI for San Francisco and Detroit.
California
The RHPI for a given city is based on January 2000 being labeled as 100 (this is the starting point for price percentage comparison.)
In San Francisco, where median home prices are reaching astronomical levels ($1.245 million at the end of 2015), RHPI presents a stark contrast to the reality. In the Bay Area, home prices remain almost unchanged since 2000, dropping only 0.4 basis points to 99.6. Since April 2015, the real price has increased only 2.6 percent, but dropped 1.5 percent compared to March numbers.
The RHPI for Los Angeles is determined to be 105.7, meaning adjusted prices in Los Angeles reveal housing price to be 5.7 percent more than in 2000. This is 4.4 percent growth over the year and only a slight change of 0.6 percent over the month.
Middle America
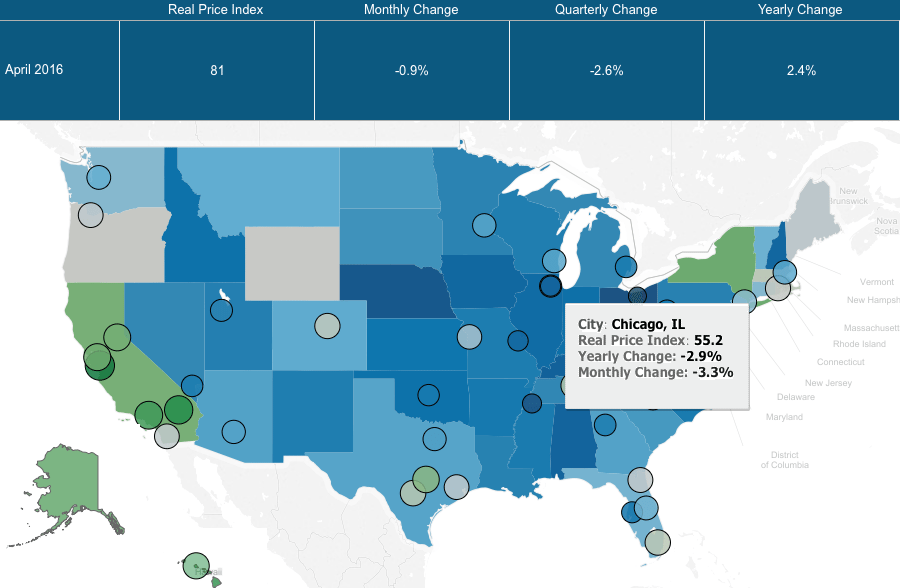
Chicago’s RHPI is 55.2. This sort of drastic difference is reflected in the lack of growth over the year (-2.9 percent), as well as the lack of growth over the month (-3.3 percent).
Houston tells a different story, though. RHPI for the sprawling Texas metro area is 83.9, with a growth of 2.6 percent on April 2015, which was 1 percent less than March.
East Coast
Miami’s steady supply of incoming inventory has little affect on RHPI. The South Florida capital’s RHPI is 88.2. Growth over the year shows 5.5, but it decreased 1.1. percent month-over-month in April.

New York City’s RHPI is 79.9, with only 0.8 percent change since April 2015, and 1.3 percent decline following March.
Baltimore registered an RHPI of 70.3. April 2015 numbers show this to be a decline of 6.5 percent year-over-year, as well as 4 percent decline month-over-month. Washington D.C.’s RHPI is 86.2. The yearly change is 2.6 percent growth, but March numbers beat it out by 1.1 percent.
“Changing incomes and interest rates either increase or decrease consumer house-buying power or affordability. When incomes rise and/or mortgage rates fall, consumer house-buying power increases. Traditional measures of house price affordability are dependent on the assumption of specific loan terms (down payment, LTV, DTI) and the choice of income level (i.e. median or average household income),” Fleming wrote in the report.
“The RHPI is not dependent on any of these assumptions and so it more broadly reflects the real price experienced by consumers regardless of their income level or the loan terms specific to their situation.”