
Home prices continue to climb as homebuilding stalls in adding enough supply to the stock.
But like most things in real estate, whether or not a city can add enough volume to meet the incoming demand depends on location, location, location.
In a recent Trulia report, the nation’s biggest metros were studied to determine homebuilding trends and local real estate prices over the past 20 years. According to the study, the national demand for housing has grown at a pretty stable pace alongside prices, but as of late, builders aren’t supplying homes fast enough to keep up with prices.
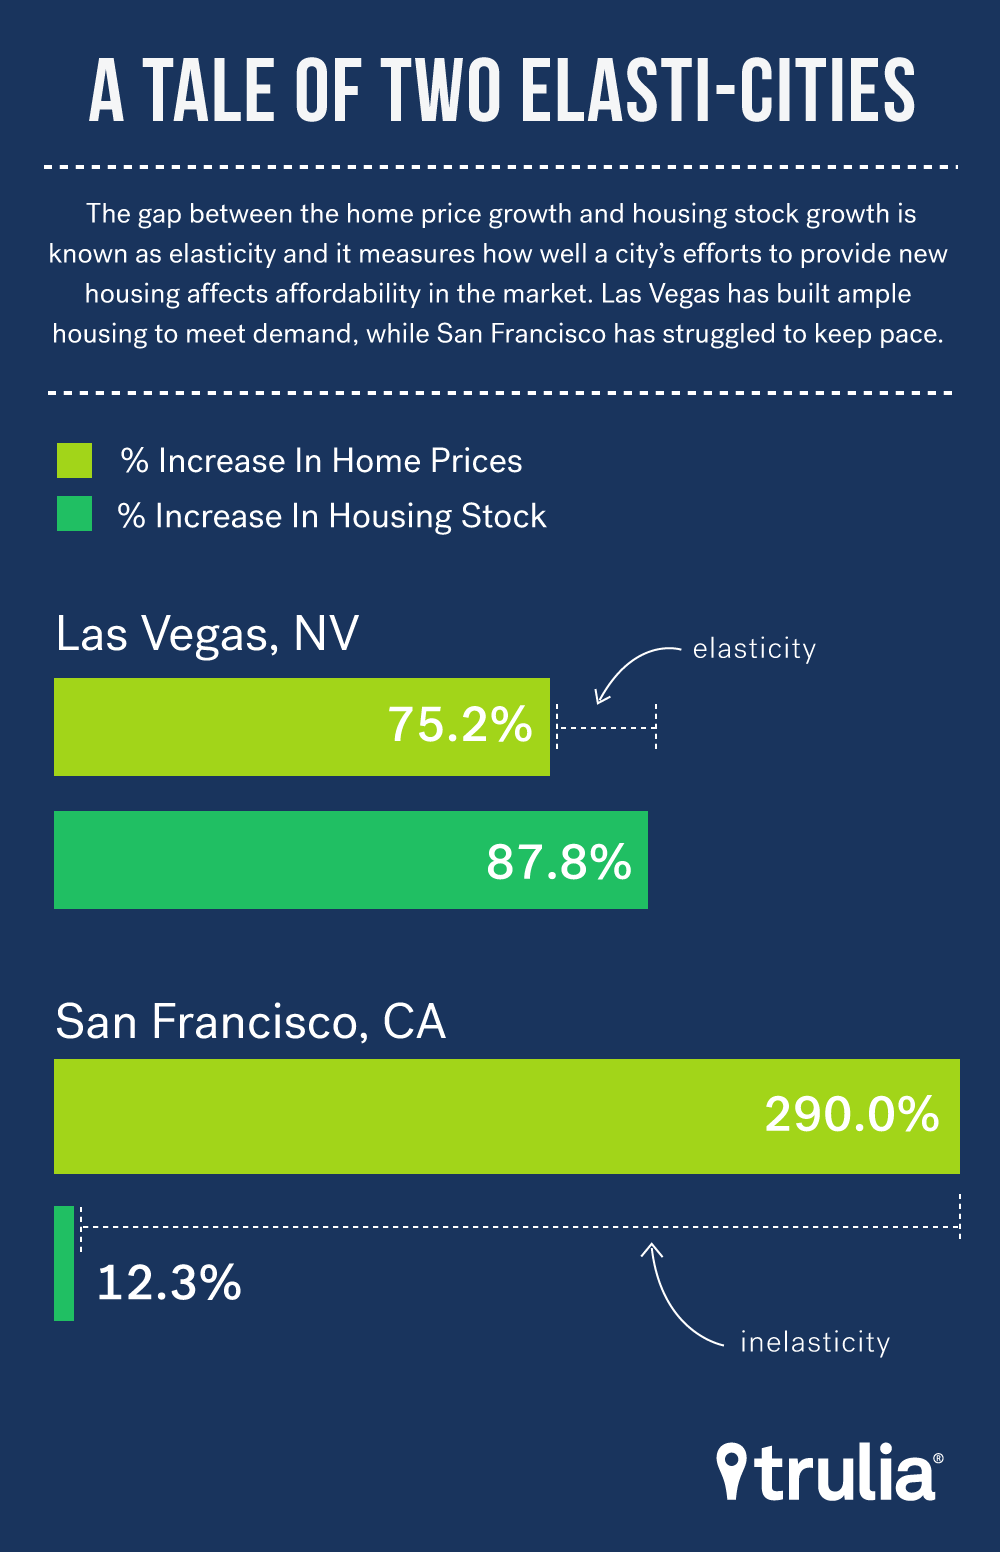
The gap between new supply and fluctuation of prices is considered “elasticity,” the report says, and markets with greater elasticity are able to keep up with the pace of housing prices. One of the biggest hurdles that each market faces is land regulation and zoning.
On a national level, long-term housing supply elasticity is at 0.17, which is three points lower than the 30-year average of 0.2. The highest point of elasticity was reported in the fourth quarter of 1999.
Supply elasticity is measured like this: If home prices increased by 1 percent, then housing stock should also increase by 1 percent within a specific period of time. In areas where regulations are less strict or land is flat and easily build-able, supply elasticity is stronger because there aren’t as many roadblocks to creating that supply.
Below, the national housing supply elasticity is measured from 1985 to 2016.

Looking at two opposite ends of the spectrum, San Francisco has seen only a 12.3 percent increase in housing stock but a 290 percent increase in home prices. In Las Vegas, home prices increased by 75.2 percent, and housing stock increased a bit more, at 87.8 percent.
Housing supply elasticity in Las Vegas between 1996 and 2016 was 1.17. During that same time period, it was 0.04 in San Francisco.
Among the markets with the highest housing supply elasticity, Washington D.C. had the highest increase in housing prices during the time period studied. Prices increased 132.3 percent, and housing stock increased 78 percent in the District, making for a housing supply elasticity of 0.59.
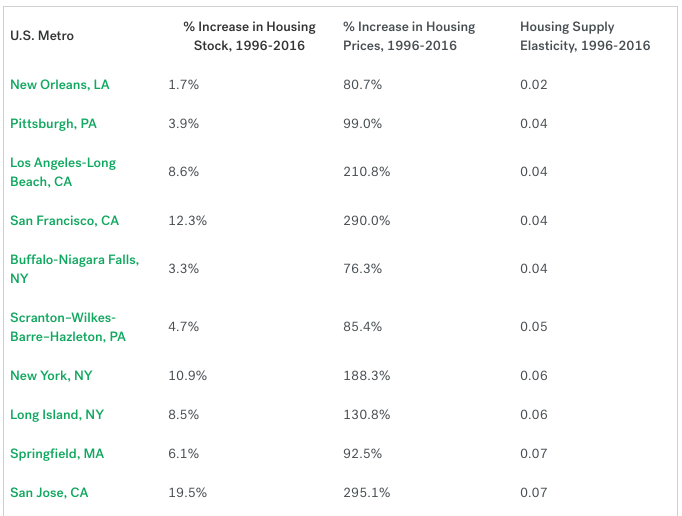
California and New York concentrated the list of markets with the lowest housing supply elasticity from 1996 to 2016. Los Angeles-Long Beach (0.04 housing supply elasticity) saw prices increase 210.8 percent and stock increase only 8.6 percent. New City (0.06 housing supply elasticity) saw prices increase 188.3 percent, while stock grew just 10.9 percent.
New Orleans ranked in the top position, with a 80.7 percent increase in prices and a 1.7 percent increase in housing supply during the studied period, although conditions in New Orleans are skewed due to the massive loss of homes after Hurricane Katrina.
In Chicago, home prices increased 53.1 percent and housing stock increased 14.3 percent. That gives the Windy City a housing supply elasticity of 0.27. It took about 6.94 months on average for building approval.
Miami saw a pretty big hike in home prices — 169.4 percent, to be exact. Housing supply here increased 23.8 percent and the city’s elasticity was 0.14 during the studied period. On average, it took about 8.35 months for a building approval to go through.
Houston had a pretty high elasticity rating of 0.42. The Texas city saw housing prices increase 127.9 percent and the supply of homes increased 54 percent during the same time period. The building approval process here isn’t too lengthy either, at an average of 2.89 months.