
Data visualizations provide key insights about the property portals.
How does each property portal measure up?
Below is a financial comparison of the major property portals — a truer apples-to-apples comparison by normalizing EBITDA — by using generally accepted accounting principles and including share-based compensation as a true cost.
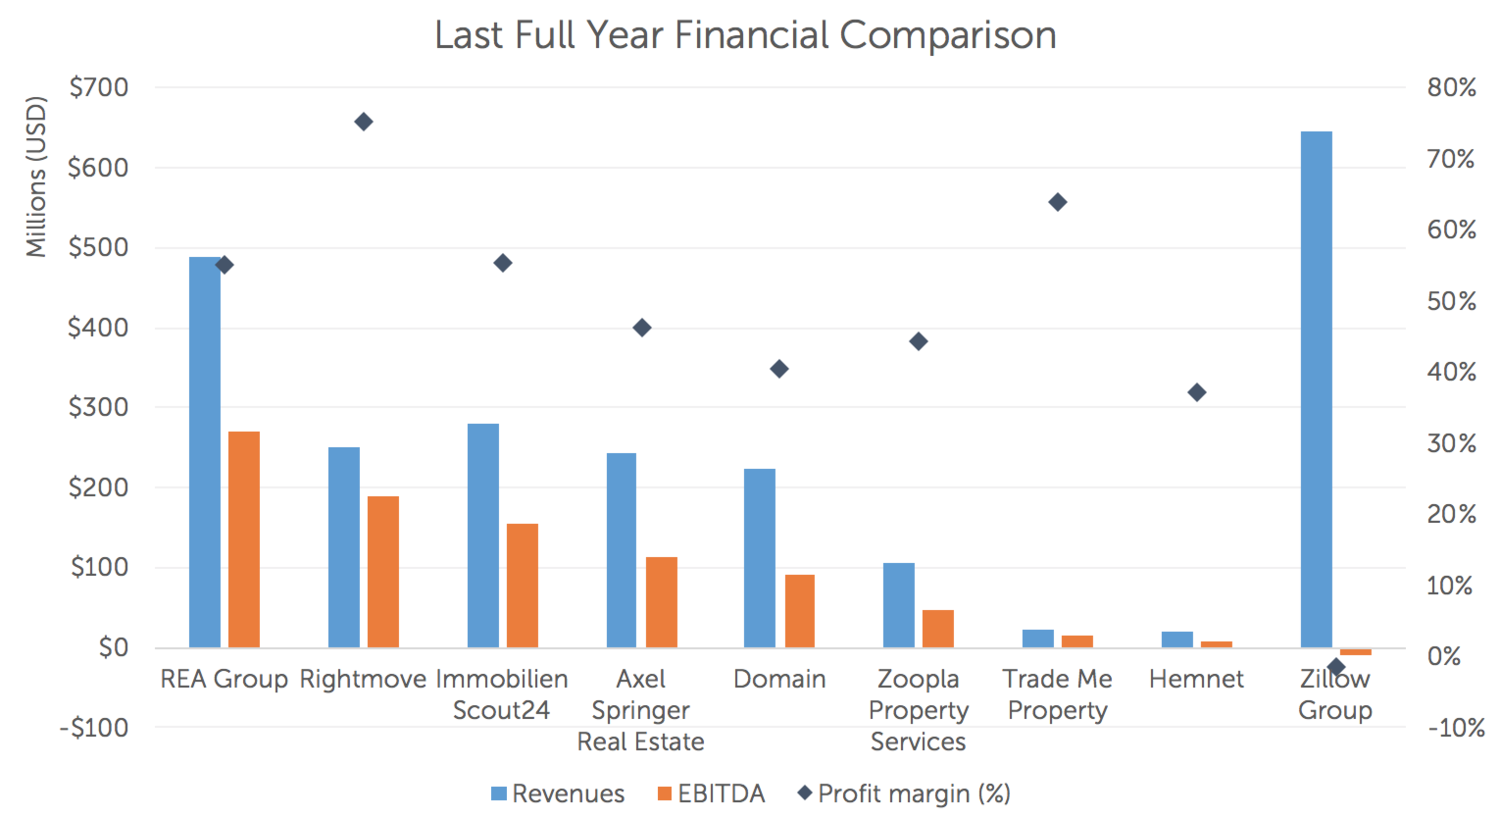
Source: annual reports, company presentation and analyst coverage. All information based on the last full year’s results (2015 or 2016).
This has the immediate effect of worsening Zillow Group’s 2015 financial results, and making it the only major portal to lose money. But it also leads to the first insight…
Insight no. 1: Zillow Group is at a turning point
Stock-based compensation (SBC) is the practice of compensating employees with stock instead of cash. According to generally accepted accounting principles, or GAAP, this form of compensation should be included as a cost.
But when Zillow Group reports earnings, it does so as “Adjusted EBITDA,” which is non-GAAP, and it does not include stock-based compensation as a cost.
Large technology companies like Amazon and Facebook now admit stock compensation is a normal cost. For a true apples-to-apples financial comparison, we need to include these costs.
The issue is that Zillow Group issues a lot of stock to compensate its employees! Over $105 million in 2015 alone, or 16 percent of its total revenue. Compared to peers around the globe, that’s a big number we can’t ignore.

Source: annual reports and company presentations.
We should also consider Zillow’s latest quarterly returns for more recent trends.
In the chart below, you will see its reported EBITDA numbers, excluding and including share-based compensation (SBC). It’s the difference between profitability and unprofitability.
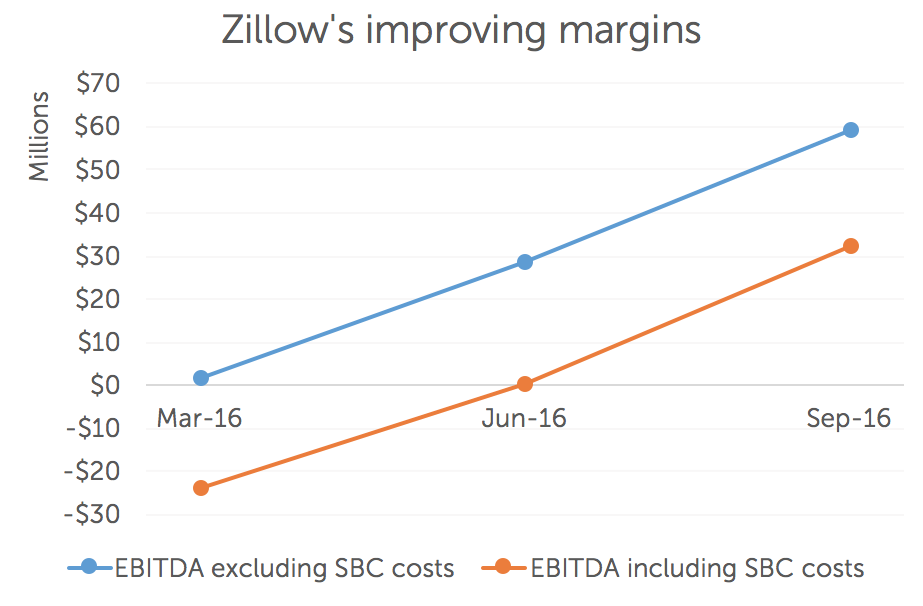
Source: Zillow Group’s quarterly results.
The last three quarters show a promising trend of profitability! Even when including stock-based compensation costs — which forms a more accurate picture of financial health — Zillow is finally managing to turn a profit.
In its last full financial year, 2015, Zillow was growing on-par with its global peers (as per below).
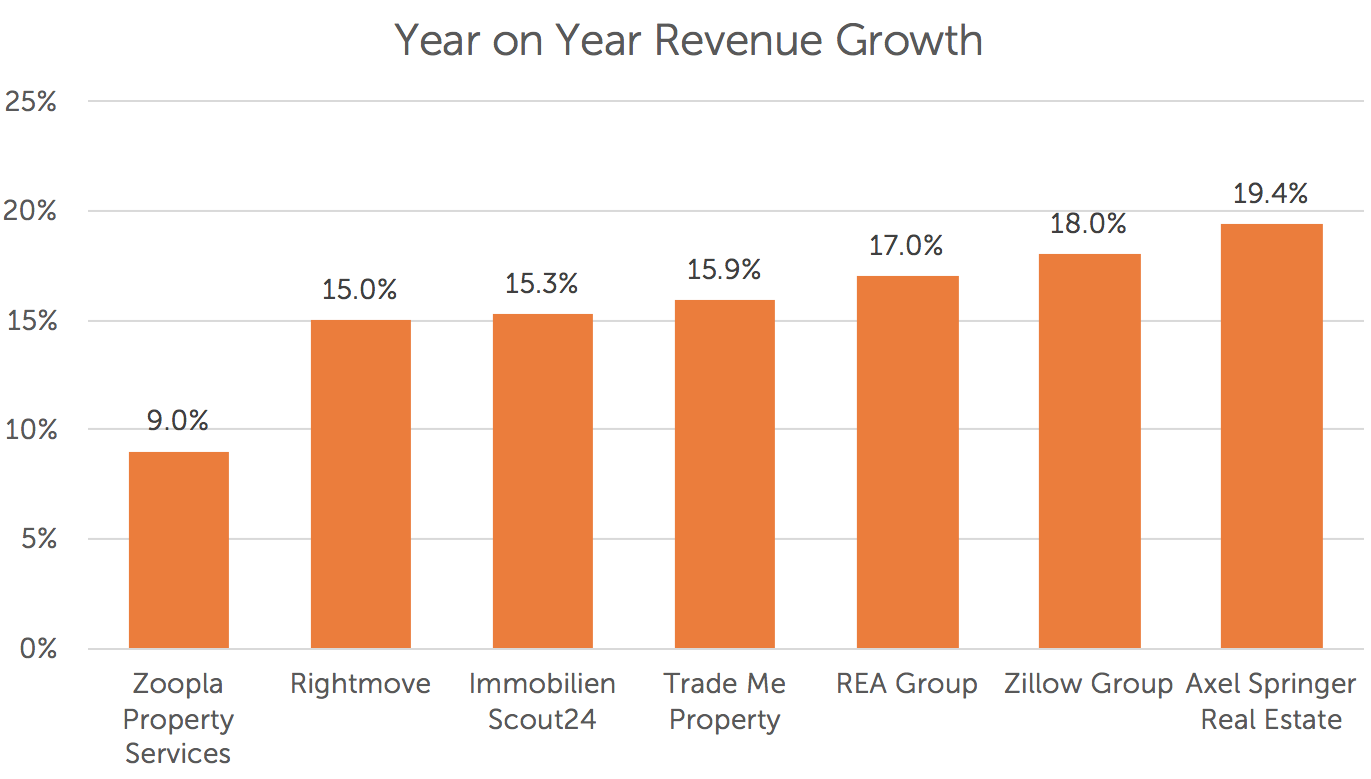
Source: annual reports, company presentations and analyst coverage. All information based on the last full year’s results (2015 or 2016).
But if the last three quarters are anything to go by (as per below), we can expect Zillow to pull ahead of the pack in a very meaningful way when it reports its 2016 full-year financial results.
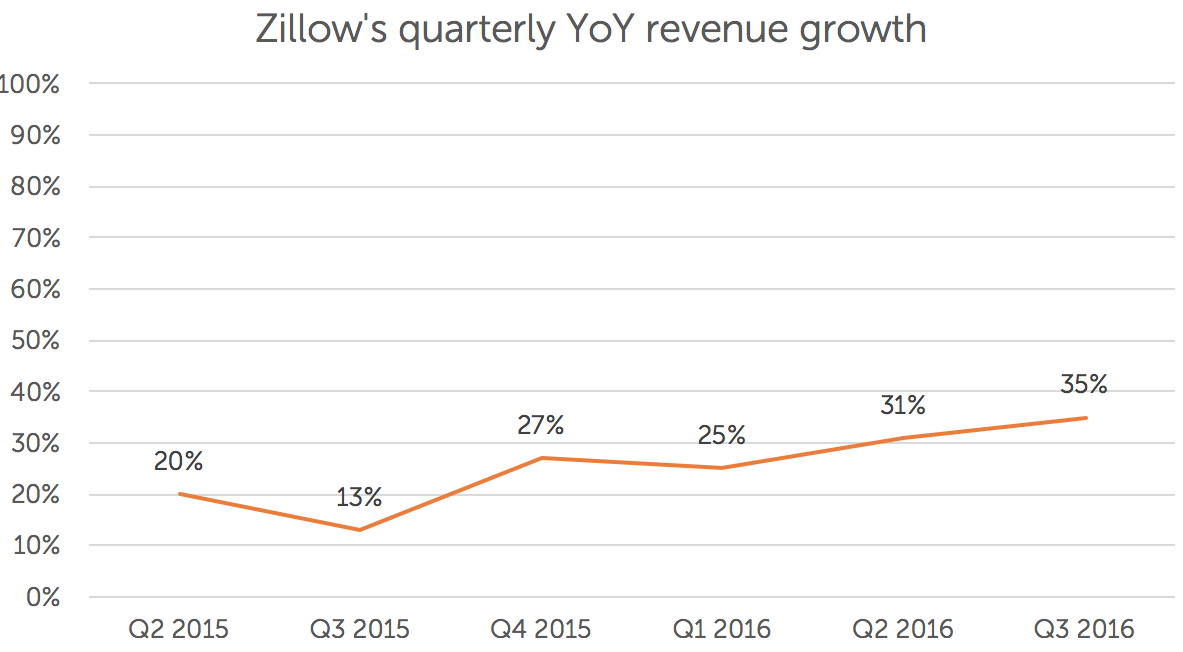
Source: Zillow Group’s quarterly results.
The signs are promising for Zillow. Revenue growth is accelerating, and it’s demonstrating an ability to turn a profit, even when including share-based compensation costs. It’s at a turning point and should be watched closely.
Before we leave Zillow for our next insight, it’s worth throwing in the following chart on board-of-director composition. I believe diversity is fundamentally important.
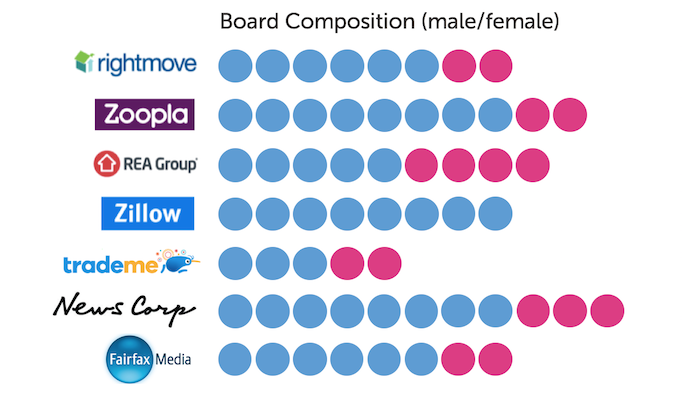
Source: company annual reports and investor web sites.
Why so blue, Zillow?
Insight no. 2: REA Group is a true global leader
I often speak about REA Group being a global leader, but the data below shows just how much it’s blowing everyone else out of the water.
Let’s start with the average revenue per advertiser (ARPA) below.
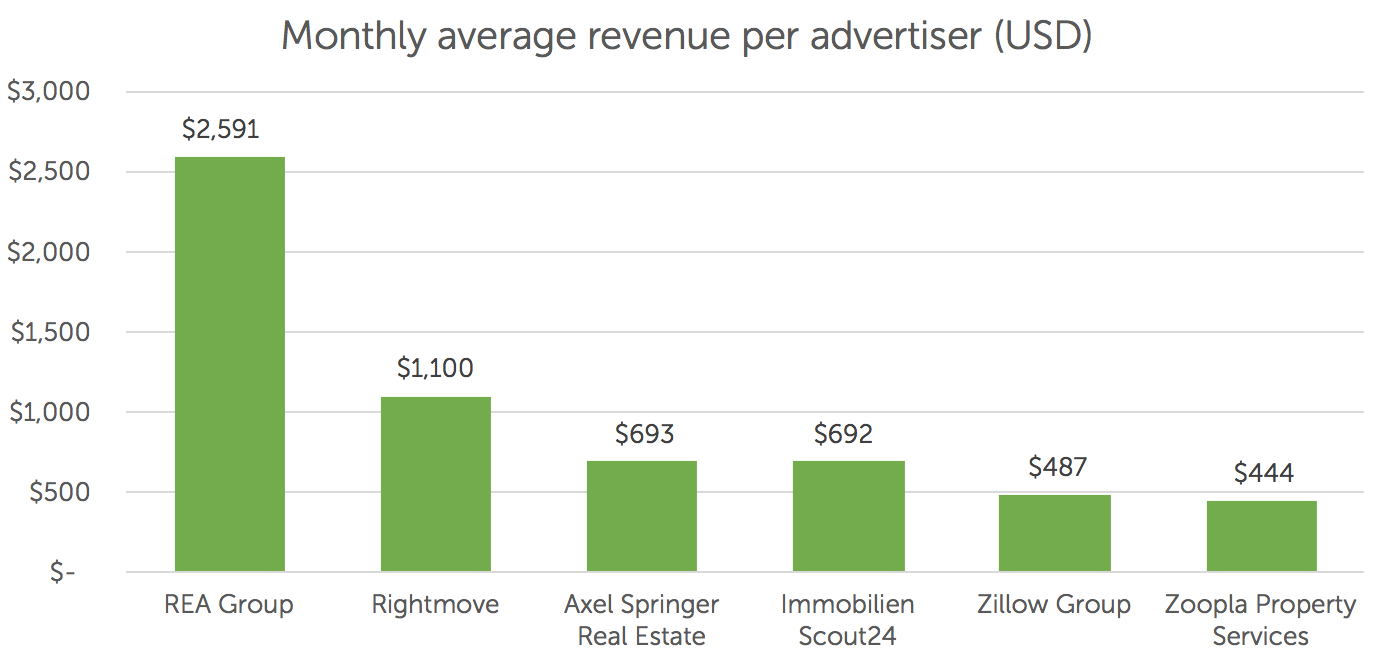
Source: annual reports, company presentations and analyst coverage. All information based on the last full year’s results (2015 or 2016).
This shows just how effectively REA Group is able to monetize its advertiser audience in Australia. It’s not just the absolute ARPA number that is impressive, but also the annual growth.
First we’re going to look at ARPA growth rates among its global peers. The other major players around the world are growing nicely, with a promising uptick for Zillow Group.
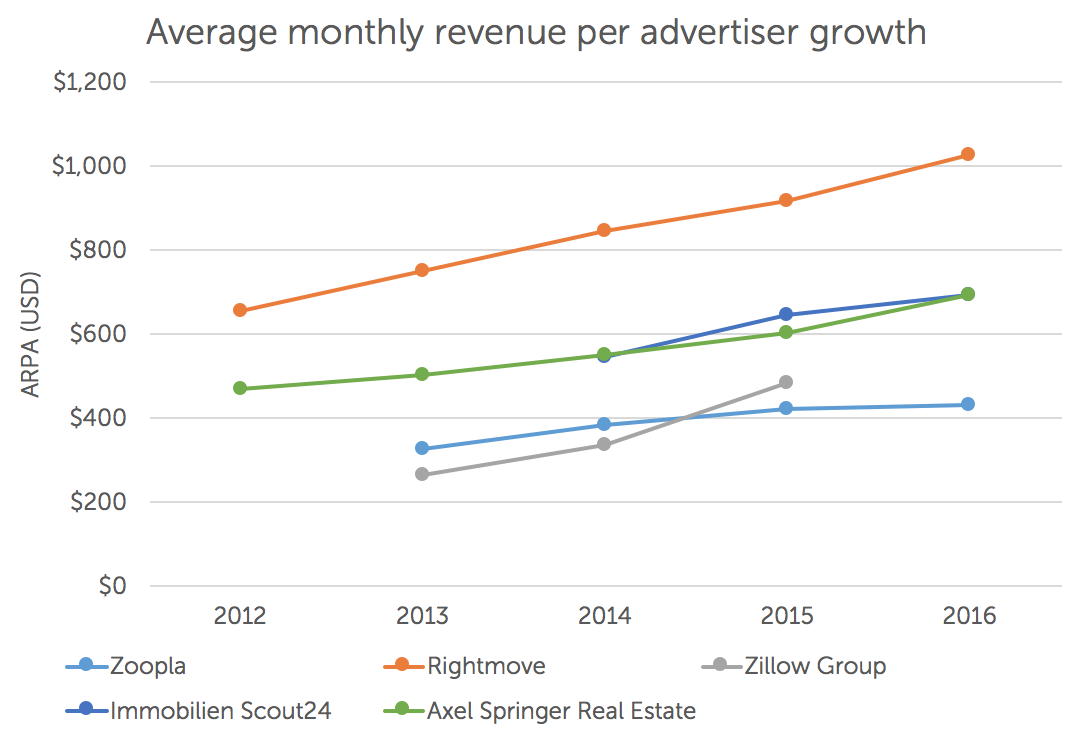
Source: annual reports, company presentations and analyst coverage. All information based on the last full year’s results (2015 or 2016).
But it’s not until you add REA Group to the mix that you realize how astronomical its growth is compared to global peers. Not only is ARPA significantly larger, but it’s growing at a faster pace.
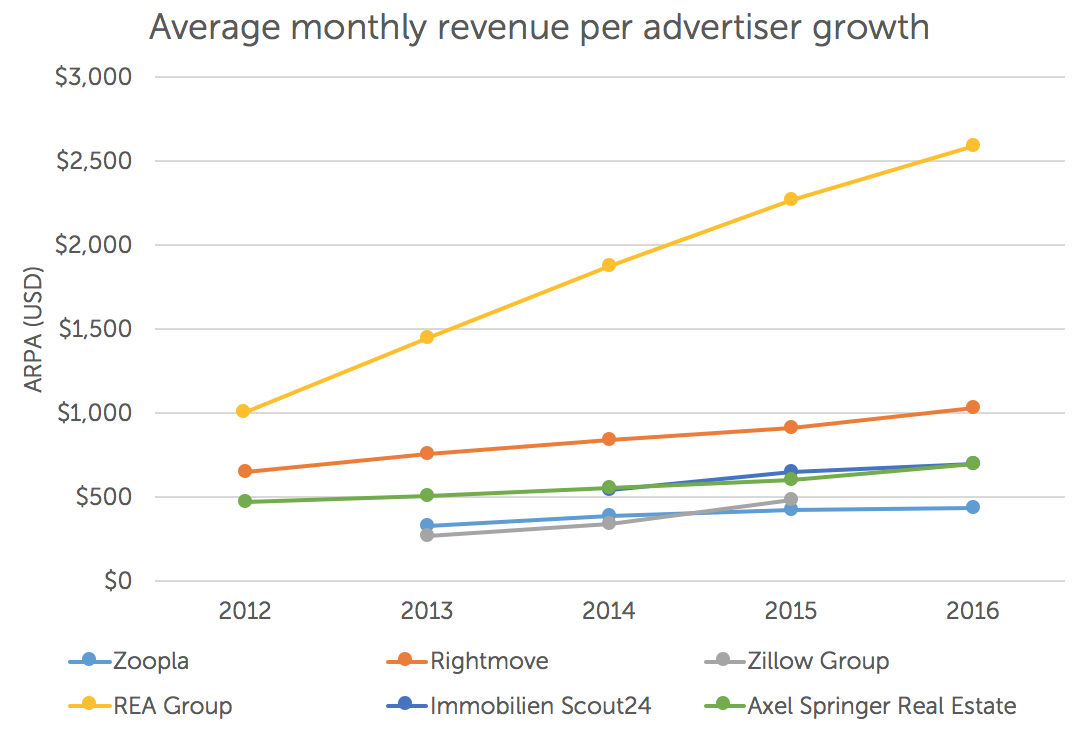
Source: annual reports, company presentations and analyst coverage. All information based on the last full year’s results (2015 or 2016).
REA Group generates more profit than any other property portal in the world.
It’s worth a quick shout-out to Rightmove, though, for being an incredibly efficient operation and having the highest profit margin of the major portals. Revenue per employee illustrates this perfectly.
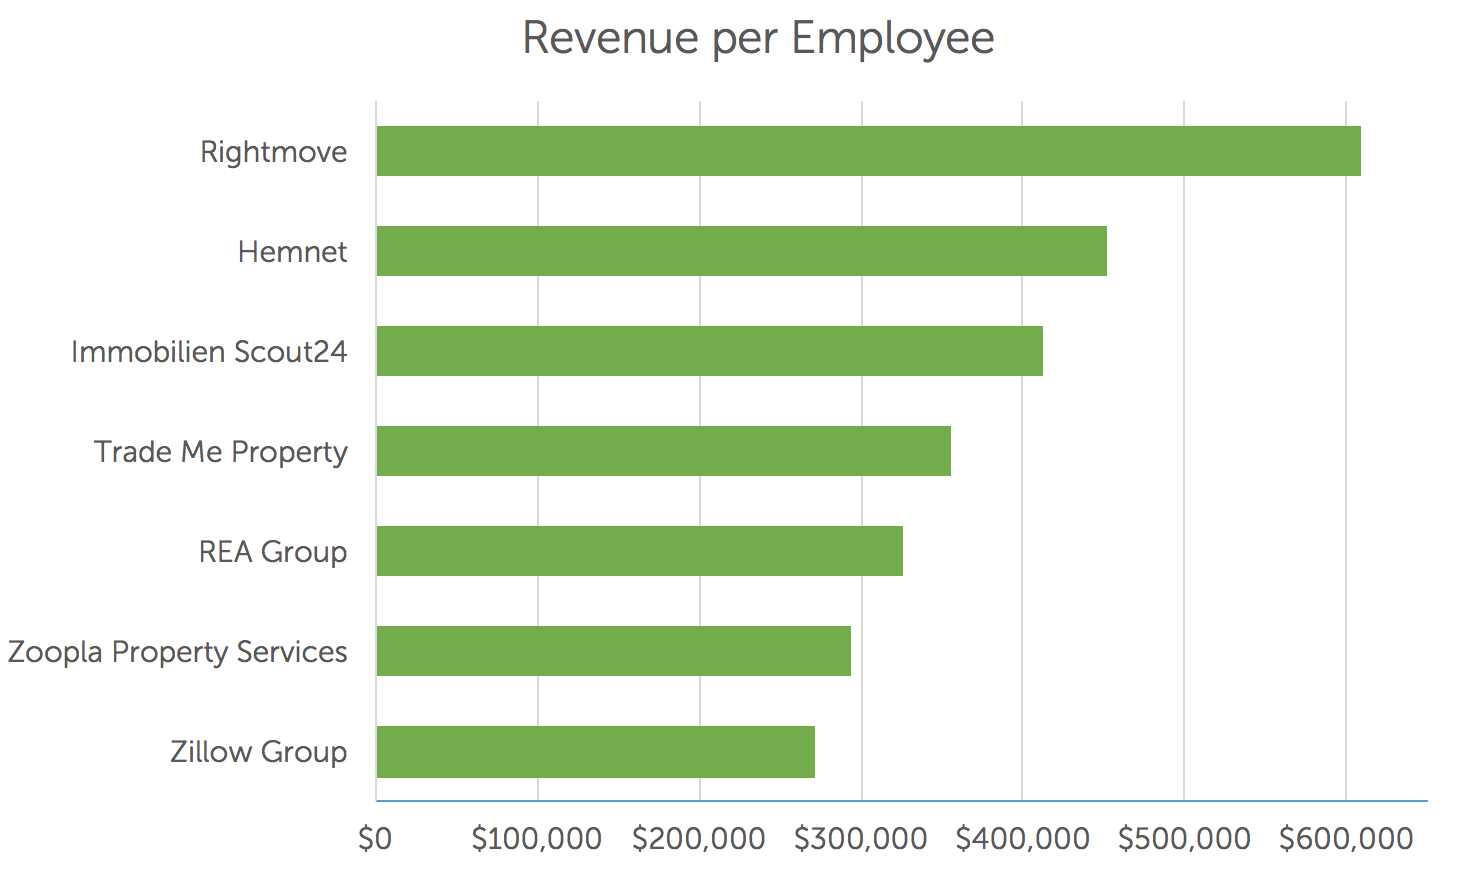
Source: annual results and company presentations. Trade Me Property and Zoopla are educated guesses based on available information and the broad nature of the larger groups.
Insight no. 3: Property portals are not winner-takes-all
With a clear leading portal in each market, there exists enough room and marketing spend for a viable no. 2 player to emerge.
I’ve opted to look at total population below because the data is easily available. It’s much more difficult to find an accurate number of transactions in each market.
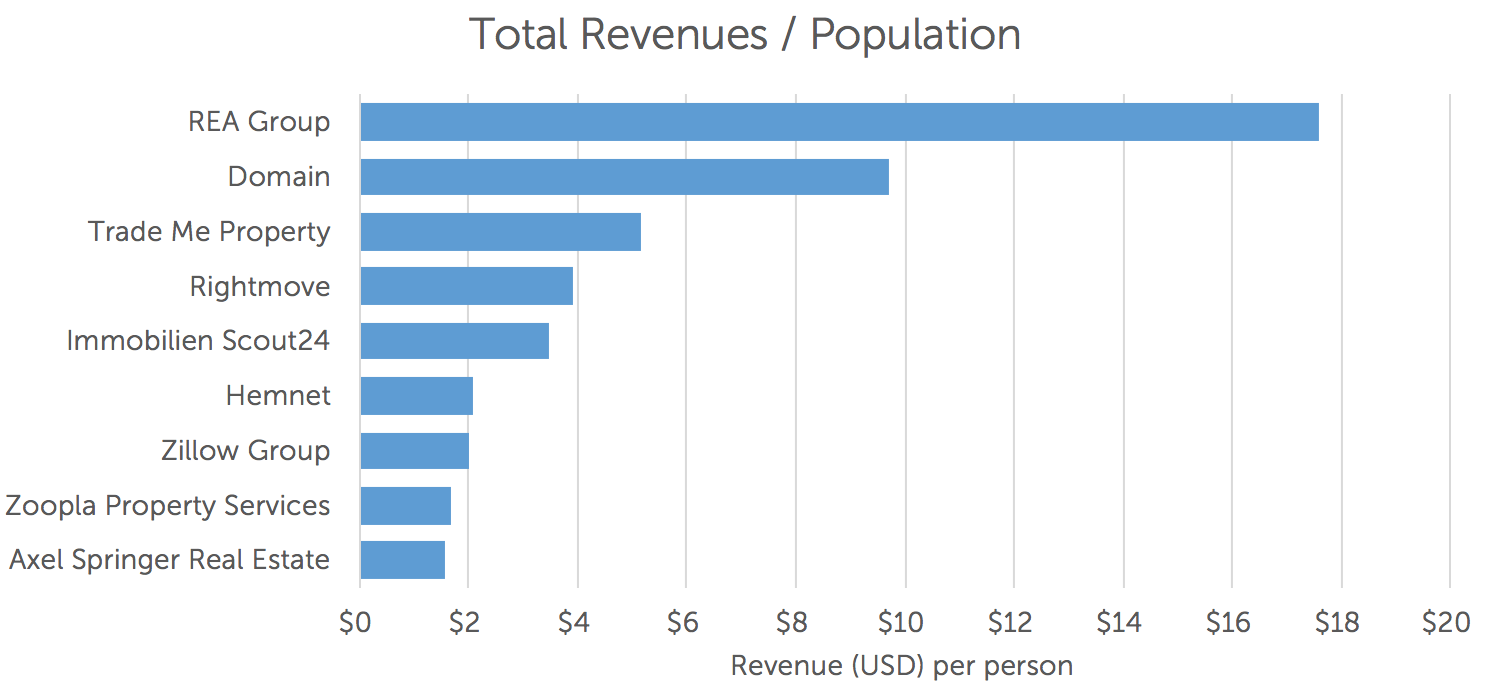
Source: annual results, company presentations and Google. Axel Springer includes Germany, France and Belgium. SeLoger is not broken out separately for France, which would likely result in a much higher number.
REA Group and Domain are the no. 1 and no. 2 property portals in Australia, and Rightmove and Zoopla are the no. 1 and no. 2 portals in the U.K.
The top portals are able to monetize between 1.8 and 2.3 times higher than the runner-up portal in each market. This is reflective of both absolute revenues as well as ARPA.
It’s worth noting that Australia and New Zealand (Trade Me Property) operate in a “vendor funded” market, meaning that homesellers — and not real estate agents — pay for advertising on the portals.
This year is going to be an interesting one in the property portal world.
Will Zillow Group successfully turn the corner of profitability? Will REA Group’s momentum in Australia continue? And how will the no. 2 players in each market grow?
Mike DelPrete is an adviser and consultant who lives in Bolton Landing and works in New York, LA, San Francisco, London and Amsterdam. Connect with him on LinkedIn.