
When reports on housing affordability come out, they often look solely at the first-time homebuyer market.
A new monthly housing affordability model designed to look at affordability conditions at different income levels for all active listings on the market was launched last week as a joint venture between the National Association of Realtors and realtor.com, the real estate portal.
And although existing-home sales are forecast to expand by 1.7 percent in 2017, this new model suggests that homebuyers at many income levels will be restricted by low inventory in their particular price range in the coming months.
The new model
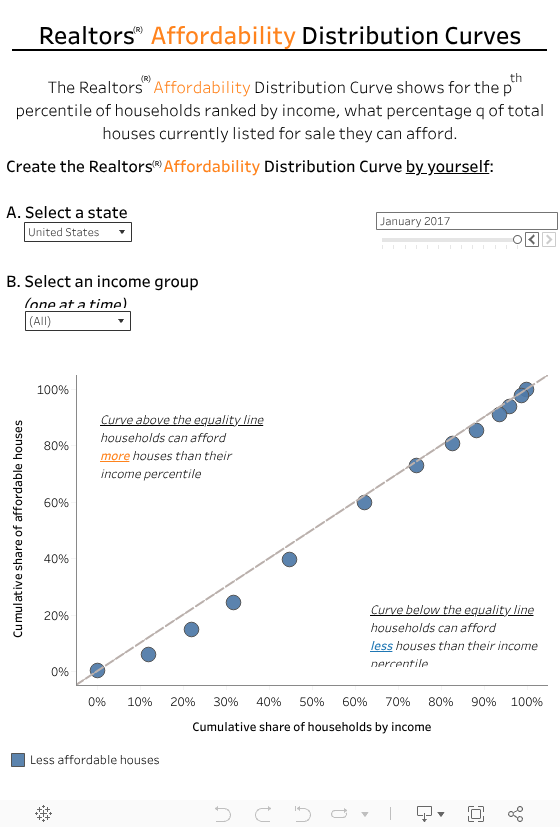
The Realtors Affordability Distribution Curve and Score, created to be a valuable resource for Realtors and consumers, will examine affordability conditions at different income levels for all the active inventory every month, drawing on mortgage data , state level income and listings on realtor.com.
The Affordability Distribution Curve will be looking at how many listings are affordable to those in a particular income percentile, while the Affordability Score, which will vary between zero and two, will be able to show, with a score of one or higher, where homes are more affordable to households in proportion to their income distribution.
What it showed in January
Lawrence Yun, NAR chief economist, said a top complaint Realtors have heard from clients is an imbalance between what they can afford and what is listed for sale.
“Home prices have ascended far past wage growth in much of the country in recent years because not enough homeowners are selling and homebuilders have not boosted enough production to meet rising demand. NAR and realtor.com’s new affordability measure confirms that buyers aren’t exaggerating about the imbalance,” he said.
Those in the lower percentiles have been worse hit, the model has found. Due to higher home prices and rising mortgage rates, households with lower incomes have been unable to afford homes on the market in 2016 and so far this year, he said.
The Affordability Distribution Curve in January found:
- A household in the 35th percentile could afford 28 percent of all listings
- A median income household in the 50th percentile could afford 46 percent of homes on the market
- A household in the 75th percentile, which could afford 74 percent of active listings
“Buyers with a lower maximum affordable price are seeing heavy competition for the fewer listings they can afford,” said Jonathan Smoke, chief economist at realtor.com.
“At a time of higher borrowing costs, this situation could affect affordability even more as buyers battle for a smaller pool of homes and bid prices upward.”
The states last month with the highest Affordability Score were Indiana, Ohio, Iowa, Kansas, Michigan and Missouri.
Those with the lowest Affordability Score were Hawaii, California, District of Columbia, Montana and Oregon.
The shortfall of inventory at a time of healthy job gains in most states is the biggest reason for the “depressed share of first-time buyers” and the inability for the homeownership rate to rise above its near record low, said Yun.
“The only prescription to reversing this adverse situation is to build more entry-level and mid-market housing that aligns with current household incomes,” he said.