
The U.S. housing market is splitting: metro areas with the highest home value appreciation over the past 30 years have grown exponentially faster than those with the slowest appreciation. And, according to a Trulia report, the split is widening.
Ralph McLaughlin, chief economist at Trulia, analyzed home values in the top 100 metro areas in the U.S. His research shows that not only are zero of those top metros in Southern and East Coast states, those markets are appreciating drastically slower than the opposite end of the spectrum.
Looking at the report, San Francisco is the hare and Dayton, Ohio, is the tortoise. Except this marathon is far from over.

McLaughlin’s report stated that in 1986, the benchmark date with which the data is set, home prices in the top 20 metros were 114 percent higher than the least expensive metros. That number is now 319 percent.
Back to the tortoise and the hare: The return on investment for betting on the hare (San Francisco) at the start of the race (1986) would yield you a $900,000 cash return if the race were actually ending today. Had you bet on the tortoise (Dayton), you’d have gotten around $50,000.
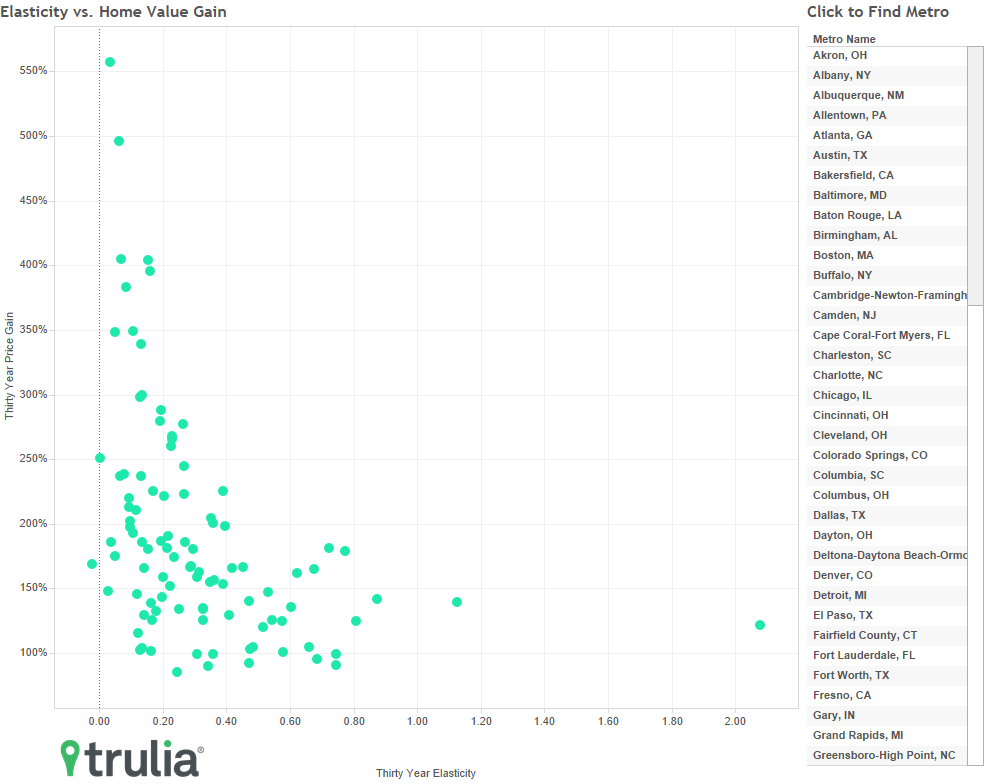
Metro areas with the highest value appreciation
Not much has changed for San Francisco in the past 30 years in regards to maintaining the no. 1 spot for highest median home value. The metro’s median home value in 1986 was $160,955 and is now $1,058,474, according to the report. The 557.6 percent increase lends credence McLaughlin’s suggestion that metro area growth and value increase correlates to income growth and new construction. However, McLaughlin presented his findings with a disclaimer including supply elasticity.
San Francisco’s growth, though, is still higher than ten selected metro area’s combined value increase of $630,242. Granted, those ten markets are midwest and eastern markets, which McLaughlin spotlighted as being the slower markets.
Oakland is ranked no. 4 on the list, showing 383 percent growth to $643,483 since 1986.
Los Angeles home values have increased 348.1 percent over the past 30 years. Back in 1986, buyers were looking at a median home price of $116,061. Now, it’s $520,060.
The Big Apple ranks no. 12 on the top 20 most expensive markets. Median home value for New York City is now at $398,630.
Washington D.C. is one of only four cities in the current top 20 that was not on the list in 1986. The median home price in D.C. is now $359,510.
Portland, Denver and Seattle also recently found themselves in the top 20.
Miami is the only east coast metro area in the top 10 for largest return. Homes sold in 2016 saw 299.7 percent return on investment from the 1986 median price of $62,385.
Baltimore’s median home value has climbed 237 percent since 1986, Trulia says. Median price is now at $244,174, or $171,724 more than 30 years ago.
Median home price in Houston in 1986 was $64,209. Prices have since increased 165.8 percent to $170,674.
Chicago, where summer home sales have exceeded early-year predictions, has seen values increase 193.2 percent since 1986. Median home price in 2016, according to Trulia, is $204,868. However, the Mainstreet Organization of Realtors just reported a $242,500 median home price year-to-date.