
Reposted with permission from buildzoom.com.
Editor’s note: Zillow Group has reached out to Inman to express concerns about how this data was obtained and to dispute the accuracy of the data.
On April 7, the freshly minted Zillow Group lost its single most important source of home sale listings when ListHub terminated its agreements with both Zillow and Trulia, raising concerns that their joint coverage would be devastated. The termination
of the agreements marks the latest skirmish in the war between Zillow Group and Move Inc., which owns both realtor.com and ListHub.
In the highly competitive real estate space, the player with the most complete listings has an enormous advantage. If consumers discover that Zillow and Trulia fall substantially short of realtor.com in this respect, no amount of brand loyalty will keep
them around. In anticipation of this threat, Zillow Group responded by launching a streamlined dashboard to their platform for agents and MLSs to easily provide them with listings directly and moved aggressively to secure MLS adoption throughout the
nation. During the past several weeks, there have been numerous reports of MLSs switching over to provide listings directly to the Zillow Group.
Did Zillow Group’s strategy succeed, or has its listing inventory been mortally decimated? To find out, we tracked the number of home sale listings on Zillow, Trulia and realtor.com on a daily basis for each county in the US. We ignored foreclosure sales,
pending home sales, and Zillow’s “make-me-move” listings.
Although Zillow Group’s inventory of listings has taken a hit, it is hardly the blow that was feared. In fact, in the larger metropolitan areas, Zillow and Trulia appear to have taken almost no hit. The declines in coverage appear to be confined to rural
America, and to a handful of metro areas, where we expect the company to concentrate its MLS recruitment efforts.
Before ListHub pulled the plug on April 7, Zillow had 2.2 million nationwide listings, Trulia had 2.1 million and realtor.com had 2.4 million. The chart below shows the how those numbers have trended since then.
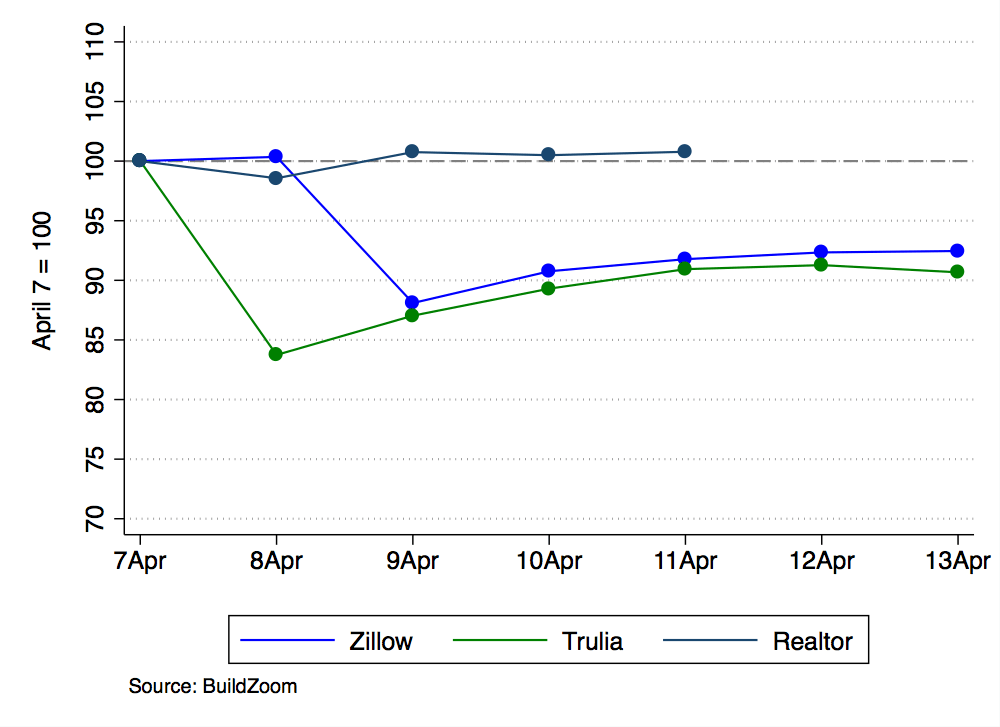 Apparently, ListHub content was removed from Trulia between April 7 and 8, and from
Zillow between April 8 and 9. For Trulia, the removal coincided with a 16.3 percent drop in nationwide listings, whereas for Zillow it coincided with a smaller drop of just 11.9 percent from the original level. Since then, the Zillow Group’s various data
initiatives have seen them rebound nicely.
The real story is in the geography
The national numbers tell only part of the story. Consumers looking to buy a home do not typically search national listings; rather, they tend to focus more locally. The following maps help illustrate how Zillow and Trulia’s local coverage has changed.
The first map illustrates the percentage change in Zillow’s number of listings by county, from April 7 to April 9. Lighter shades imply a greater loss of coverage. Small daily fluctuations in the number of listings are normal and are captured by the second
darkest shade, which spans all changes in Zillow’s listings smaller than 10 percent up or down. It is a good sign for Zillow that most of the map is this color, which explains that for most areas, their coverage has not dramatically changed.
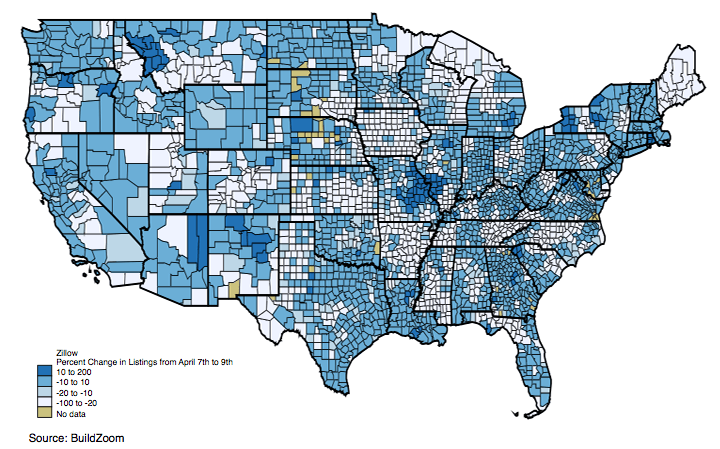
The lighter shades of blue, highlight areas where Zillow’s coverage has either mildly suffered or substantially deteriorated. Although sizable swaths of the map exhibit these colors, the areas hit tend to be disproportionately rural, with loss of coverage
mostly bypassing the vast majority of metropolitan areas.
Finally, the darkest shade of blue indicates areas in which Zillow’s listings have actually increased. This is obviously not a direct result of the removal of ListHub content, but it is likely an indirect result, whereby the Zillow Group’s newly obtained
data sources have generated a net improvement in coverage.
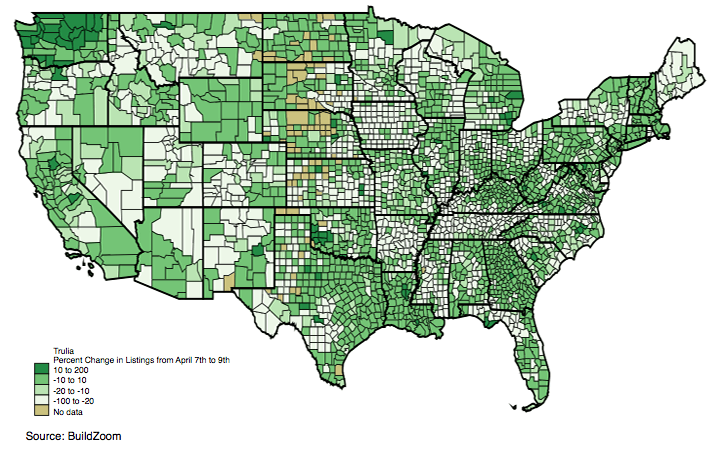
The second map repeats the exercise with respect to Trulia. Although the maps differ in detail, largely reflecting prior coverage differences between the two websites, the broad picture they paint for Trulia and Zillow is similar.
Beyond the maps – breakdown by metro area The maps are useful in illustrating broad patterns of coverage loss versus retention, but in order to provide a more granular and precise record of the changes, we broke down the data by metro area. The
numbers for metro areas with population over 1 million are given in the table below. Data for additional metro areas are available in Excel format, here.
Crucially, Zillow Group took very little hit, if any, in most of the large metro areas. The noteworthy exceptions are San Diego, Denver and Charlotte, in which a substantial amount of coverage was lost. On the other hand, in some places, such as St. Louis,
Zillow Group actually gained enough listings through its recent efforts to outweigh any loss due to ListHub.
Despite the hit to its listing inventory, our impression is that Zillow Group has essentially defied the blow. From this point on, we anticipate that Zillow Group’s efforts to obtain listings in most of the areas where it now falls short will be successful.
The termination of Zillow Group’s agreements with ListHub has forced the company to create an alternative, and it has stood up to the challenge admirably well. We would not be surprised if in the future there emerged areas in which Zillow Group’s coverage,
now independent of ListHub, were to exceed realtor.com’s.
| Metro Area | Population (2010) | Change in listings (%) | ||
|---|---|---|---|---|
| Zillow | Trulia | Realtor | ||
| Salt Lake City, UT Metro Area | 1,087,873 | -39.31 | -35.33 | 0.19 |
| Memphis, TN-MS-AR Metro Area | 1,324,829 | -36.41 | -25.27 | -3.58 |
| Charlotte-Concord-Gastonia, NC-SC Metro Area | 2,217,012 | -33.10 | -19.50 | 0.78 |
| Milwaukee-Waukesha-West Allis, WI Metro Area | 1,555,908 | -33.08 | -31.30 | 0.69 |
| Raleigh, NC Metro Area | 1,130,490 | -31.27 | -21.47 | 0.77 |
| Denver-Aurora-Lakewood, CO Metro Area | 2,543,482 | -30.93 | -26.28 | 1.54 |
| Oklahoma City, OK Metro Area | 1,252,987 | -25.59 | -22.12 | -0.14 |
| San Diego-Carlsbad, CA Metro Area | 3,095,313 | -22.55 | -17.72 | 0.78 |
| Cincinnati, OH-KY-IN Metro Area | 2,114,580 | -22.49 | -5.40 | 0.93 |
| Birmingham-Hoover, AL Metro Area | 1,128,047 | -19.69 | -14.53 | 0.73 |
| Rochester, NY Metro Area | 1,079,671 | -17.22 | -22.39 | 1.01 |
| Louisville/Jefferson County, KY-IN Metro Area | 1,235,708 | -14.31 | -9.45 | 0.11 |
| Columbus, OH Metro Area | 1,901,974 | -10.98 | -9.72 | 1.27 |
| Minneapolis-St. Paul-Bloomington, MN-WI Metro Area | 3,348,859 | -9.81 | -10.19 | 0.98 |
| Virginia Beach-Norfolk-Newport News, VA-NC Metro Area | 1,676,822 | -8.51 | -20.66 | 0.58 |
| San Antonio-New Braunfels, TX Metro Area | 2,142,508 | -8.47 | -27.16 | 0.51 |
| San Francisco-Oakland-Hayward, CA Metro Area | 4,335,391 | -7.62 | -8.85 | 13.26 |
| Miami-Fort Lauderdale-West Palm Beach, FL Metro Area | 5,564,635 | -7.43 | -3.59 | -50.81 |
| Kansas City, MO-KS Metro Area | 2,009,342 | -6.92 | -18.33 | 1.10 |
| Las Vegas-Henderson-Paradise, NV Metro Area | 1,951,269 | -6.45 | -31.35 | 17.28 |
| Los Angeles-Long Beach-Anaheim, CA Metro Area | 12,828,837 | -4.65 | -6.59 | 0.56 |
| Pittsburgh, PA Metro Area | 2,356,285 | -3.23 | -3.33 | 0.70 |
| Jacksonville, FL Metro Area | 1,345,596 | -3.01 | -2.76 | 0.28 |
| Seattle-Tacoma-Bellevue, WA Metro Area | 3,439,809 | -2.50 | 15.61 | 2.92 |
| Tampa-St. Petersburg-Clearwater, FL Metro Area | 2,783,243 | -2.38 | -13.03 | 0.19 |
| Houston-The Woodlands-Sugar Land, TX Metro Area | 5,920,416 | -2.01 | -3.08 | 0.95 |
| Sacramento–Roseville–Arden-Arcade, CA Metro Area | 2,149,127 | -1.91 | -6.52 | 1.05 |
| Austin-Round Rock, TX Metro Area | 1,716,289 | -1.81 | -0.70 | 0.80 |
| Riverside-San Bernardino-Ontario, CA Metro Area | 4,224,851 | -1.79 | -3.55 | 0.16 |
| Chicago-Naperville-Elgin, IL-IN-WI Metro Area | 1,443,963 | -1.12 | -6.31 | 1.04 |
| Philadelphia-Camden-Wilmington, PA-NJ-DE-MD Metro Area | 5,965,343 | -1.00 | -7.85 | 1.20 |
| Portland-Vancouver-Hillsboro, OR-WA Metro Area | 2,226,009 | -0.88 | -10.61 | 0.59 |
| Atlanta-Sandy Springs-Roswell, GA Metro Area | 5,286,728 | -0.69 | -5.53 | -12.25 |
| Cleveland-Elyria, OH Metro Area | 2,077,240 | -0.69 | -16.55 | 0.67 |
| Indianapolis-Carmel-Anderson, IN Metro Area | 1,887,877 | -0.38 | -4.98 | 0.52 |
| Phoenix-Mesa-Scottsdale, AZ Metro Area | 4,192,887 | 0.25 | -1.51 | -0.31 |
| Dallas-Fort Worth-Arlington, TX Metro Area | 6,426,214 | 0.32 | -3.00 | 1.22 |
| Richmond, VA Metro Area | 1,208,101 | 0.85 | -6.07 | 0.34 |
| Orlando-Kissimmee-Sanford, FL Metro Area | 2,134,411 | 1.05 | -3.54 | 0.14 |
| New York-Newark-Jersey City, NY-NJ-PA Metro Area | 19,567,410 | 1.06 | -3.18 | 0.90 |
| Hartford-West Hartford-East Hartford, CT Metro Area | 1,212,381 | 1.38 | -0.55 | 28.58 |
| Nashville-Davidson–Murfreesboro–Franklin, TN Metro Area | 1,670,890 | 2.37 | -28.77 | 0.77 |
| New Orleans-Metairie, LA Metro Area | 1,189,866 | 2.53 | -0.99 | -0.47 |
| Baltimore-Columbia-Towson, MD Metro Area | 2,710,489 | 4.00 | -3.84 | 5.50 |
| Washington-Arlington-Alexandria, DC-VA-MD-WV Metro Area | 5,636,232 | 4.14 | -4.66 | 8.50 |
| Boston-Cambridge-Newton, MA-NH Metro Area | 4,552,402 | 4.44 | 2.41 | 5.31 |
| San Jose-Sunnyvale-Santa Clara, CA Metro Area | 1,836,911 | 5.76 | 1.68 | 4.87 |
| Providence-Warwick, RI-MA Metro Area | 1,600,852 | 10.98 | -23.96 | 1.49 |
| Detroit-Warren-Dearborn, MI Metro Area | 4,296,250 | 11.34 | 11.26 | 0.83 |
| Buffalo-Cheektowaga-Niagara Falls, NY Metro Area | 1,135,509 | 24.12 | -23.45 | 0.66 |
| St. Louis, MO-IL Metro Area | 2,259,750 | 42.72 | -7.66 | 1.18 |
– See more at: http://blog.buildzoom.com/mls-wars#sthash.T9Mi2aO3.dpuf
Issi Romem is the chief economist at BuildZoom.