Readers who prioritize second homes and investment properties turn to Inman’s weekly Property Portfolio email newsletter, whether they’re agents who work with this special class of clients or investors themselves. This month, we’ll go deeper on everything from the latest at Airbnb and Vrbo to the changes investors are making to their portfolios in a shifting real estate market.
Would you like to know the best years in the future to make money?
In 1995, the late Ed Heron shared a chart with me that had accurately predicted the recessions, depressions and busts dating all the way to back 1810. I kept a copy of this chart in my files for 28 years and have searched for an update to that original chart since before 2000.
A few weeks ago, my husband found an updated version of the same chart that extends to 2053. There’s every reason to believe that the predictions in the updated chart will be as accurate as those in the original.
Recession, depression or bust?
Heron shared the 1958 article below with his office back in 1982. Although the chart in this article has a beginning date of 1850, the actual data goes all the way back to 1810 with a cut-off date of 2000. What’s fascinating is this chart has predicted what has happened since 2000 with uncanny accuracy.
The most important point to note about this chart is, “It takes 17 years to go up and clear back down again.” This 17-year market cycle has been a reliable predictor of whether we will have a recession, depression or bust for over 200 years.

Other important takeaways include:
- In terms of when to buy or sell, Period A is the top of the market with good times and high prices. Period C are the years in which panics have occurred in the past and will occur again in the future.
- The “sweet spot” in terms of buying is during Period B, where the market is moving through the middle range on the chart.
- To illustrate this point, the chart accurately predicted the savings and loan debacle in the early 1980s that resulted in mortgage rates being as high as 17 percent or 18 percent for a 30-year fixed-rate mortgage. In addition, even though the chart cuts off at 1999, the dot-com bust arrived right on schedule in the early 2000s.
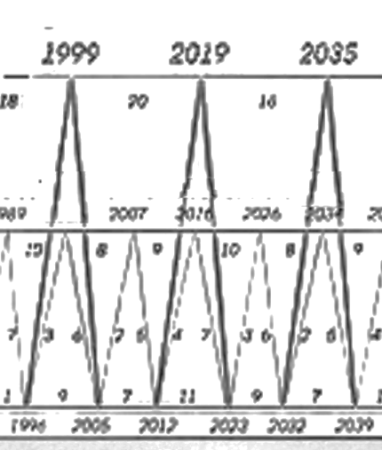
The second chart includes the original chart’s data beginning in 1924 and extends to 2053.
 The chart above shows the run-up to the 2007-2008 Great Recession. Beginning in 2016, we crossed over into Period A, good times and high prices, but started declining in 2019 (This was a seven-year cycle). That means 2023 is the bottom point for Period C.
The chart predicts that we will have another upswing until about 2026, and then we will hit the next bottom in 2032.
Market cycles are predictable
I shared both these charts with Chris Naugle, “America’s No. 1 Money Mentor.” Naugle spent 16 years on Wall Street working at the highest levels with major hedge funds. He hadn’t seen these charts before but says they coincide with the five to seven year short-term debt cycles he has observed, as well as the 50 to 70 year long-term debt cycle.
According to Naugle,
The most important thing to understand is that a lot of people when they’re looking at the stock market, they think things are coincidences. They think that it’s by chance that the markets are going down or that it’s a circumstantial thing tied to what’s happening such as bank failures.
These are all just pieces of the equation, a part of a bigger picture, and that bigger picture is the market cycles, as these age-old charts show. Look how far back this goes — it really tells the story.
Most people would look at this and say, “No way, this is like Nostradamus predicting the future.” It is not predicting the future. It’s merely understanding a simple economic or market cycle.
Naugle went on to explain that even though he had been on Wall Street for 16 years, he didn’t always understand the market cycle concept. The reason?
Wall Street didn’t teach us this stuff. Instead, they taught us how to sell financial products, how to go out and help people prepare for retirement by managing their money and putting it in financial investments.
Moreover, most financial advisors have no knowledge of these cycles nor do they track them. The reason?
It’s not conducive for them making more money, doing more business, or getting more clients.
Naugle said that when he left Wall Street in 2018, he turned into a nerd and studied the wealthiest families, the market patterns, and market cycles. Based upon what he discovered, he advises investors to
Ignore the news, because it’s always a lagging indicator — it’s only about the past.
Most people buy and sell at the exactly wrong time
When it comes to real estate investing, Naugle and I have both observed that the most successful investors are contrarians. They buy when others are selling (during the down times), and they sell when others are buying.
Naugle has studied the psychology of buying at the wrong time and explains it like this:
Warren Buffet has always said that if you want to make money investing, follow three steps. Number one, buy low. Number two, sell high. Number three, don’t lose money. What he doesn’t say is that if you do number one and number two, number three is automatic.
But here’s where most people make a mistake:
Our psychology wants us to buy high because we want to buy when everything feels good. When we feel optimistic and excited, when we feel thrilled, when we have that euphoria, and a feeling of relief, that’s exactly the wrong time to buy and these charts prove it. It’s absolutely the time to sell, not the time to buy.
We follow the herds. We hear about crypto from an Uber driver, it’s going to the moon, and do what we can to find a way to buy it. We don’t even know what we’re investing in, because we have completely forgotten as a society about the third law of wealth, which is to protect your wealth by investing in things that you know, like, and understand. So inherently, we buy in the wrong cycles.
In terms of the buy part of the cycle:
It is marked by anxiety, fear, denial, capitulation, depression and despondency. That’s when you should be buying, exactly when everyone else is selling. But what are you doing? You’re getting scared, you have anxiety, you don’t know what to do, and then you freeze like a deer in the headlights. That’s when you should be buying.
A lot of people can’t see past the temptation of FOMO (fear of missing out). But when you take off the rose-colored glasses and see things for what they really are, you make decisions based on pure logic and not emotion. Doing that will allow you to avoid the financial pitfalls that come along with emotion-based decision-making.
The 3 types of debt cycles
Naugle has been training about how debt cycles work for years. Everyone is familiar with home, car and credit card debt. Most people also know about the U.S. debt and corporate debt. The three primary types of debt cycles include:
Productivity
This is the normal growth of an economy. We go to work, we produce a product and we sell the product. The cycle keeps repeating over and over. It’s the normal cycle. It is slow and predictable.
Short-term debt cycles
Naugle says these cycles last five to seven years. You can see the five to seven cycles on both charts (the two shortest parts of the “M.”) For example, the first one in the chart below would be the dot-com bust that took place in the early 2000s. That was followed by a seven-year upswing that led to the Great Recession in 2007. You then see the run-up from the Great Recession all the way to 2019, which was the beginning of the pandemic, followed by the five-year cycle bottoming in 2023. The longer run-ups are followed by the shortened cycles.
What’s fascinating is that three 17-year cycles are about 51 years, and four 17-year cycles are about 68 years. It’s easy to see how these various cycles fit together to accurately predict what has happened in the past and what will most likely happen in the future.
Long-term debt cycles
Naugle says virtually no one tracks the 50 to 70-year debt cycles. What’s disturbing is:
We don’t live in a productivity economy anymore. We live in an economy that is fueled by debt, massive amounts of debt, $5.1 trillion worth of debt that they called “stimulus” during the COVID pandemic.
As Naugle stated earlier, what is happening now has nothing to do with the bank failures, the war or anything else in the news. It’s all part of these economic cycles.

Where we are now
Naugle says that there is some debate about when the last long-term debt cycle began with some experts saying it began about 1934 and others saying the date is about 1940.
The important point to note on Naugle’s chart above is that we are coming off a 50- to 70-year cycle of debt accumulation. This cycle has peaked and we’re now moving into a major downturn that involves deleveraging the debt, which also results in price declines.
If you’re a real estate investor, Naugle believes this new cycle will be the best time in our lifetimes to acquire properties that will generate great returns. For everyone else, it’s going to be very much like the Great Recession.
Play the short game for now, but get ready to go shopping
Looking at these cycles, Naugle’s take on the current situation is:
We’re going to have a small run-up from 2023 to 2026. Then it drops and hits bottom in 2032. Right now, play the short game. When we get to approximately 2026, watch your friends, your family, watch all the people you work with, and when they’re freaking out, when you hear them talking about their losses in their 401K, and you’re hearing about all the layoffs and how bad it is, it’s time to go shopping.
It doesn’t really matter what you buy, but remember, only buy and invest in things that you know, like and understand, which is the third law of wealth.
Naugle’s 6 Laws of Wealth
In addition to tracking the various debt cycles, here are the Six Laws of Wealth that Naugle teaches at his seminars. (You can view his detailed discussion of these laws here.)
Pay yourself first
Keep or save one-tenth of the money you earn. If you make $10,000, keep or save $1,000.
Put your money to work for you
Whether it’s through savings, real estate investing, or some other financial opportunity, you’ve spent your whole life working for money — now it’s time to send your money out to work for you.
Protect your wealth
Invest in things that you know, like and understand and with people who have the knowledge through time, wisdom and failure.
The difference between someone who is rich vs. someone who is wealthy is that those who are wealthy have learned how to protect their wealth and don’t have to give their money back anymore. The rich have the fanciest cars, the fanciest clothes, the designer bags and the Rolexes, but constantly go through cycles of having lots of money and then going broke because they haven’t learned how to protect their wealth.
If you seek unrealistic returns, your money will flee from you
We most recently saw this phenomenon with bitcoin and other cryptocurrencies. This pattern has repeated itself for hundreds of years — when there’s a big run-up as people get greedy and then it all crashes.
Share what you know and give generously without conditions
Naugle says this is the most important law. Zig Ziglar said it best, “You will get everything you want in your life if you help enough people get what they want, and not ask for anything in return.”
Leave a legacy that is bigger than you
People often confuse legacy with the house they’re leaving the kids or the money they have in their bank account. Naugle points out that when you’re at the funeral of someone you care about, do you think about what kind of car they drove, the house they lived in, or the money they had in the bank?
What we remember is how that person made us feel and the memories we have of them. Legacy is about the way you leave this earth and the way you changed other people’s lives.
Tracking both short-term and long-term debt cycles, especially the 17-year market cycles, allows savvy investors to better anticipate potential recessions, depressions and periods of economic growth and to make informed decisions about when to buy and when to sell. Ultimately, however, smart investing comes down to: “Be a contrarian” — sell when others are buying and buy when others are selling.
Bernice Ross, president and CEO of BrokerageUP and RealEstateCoach.com, is a national speaker, author and trainer with more than 1,000 published articles. Learn about her broker/manager training programs designed for women, by women, at BrokerageUp.com and her new agent sales training at RealEstateCoach.com/newagent.