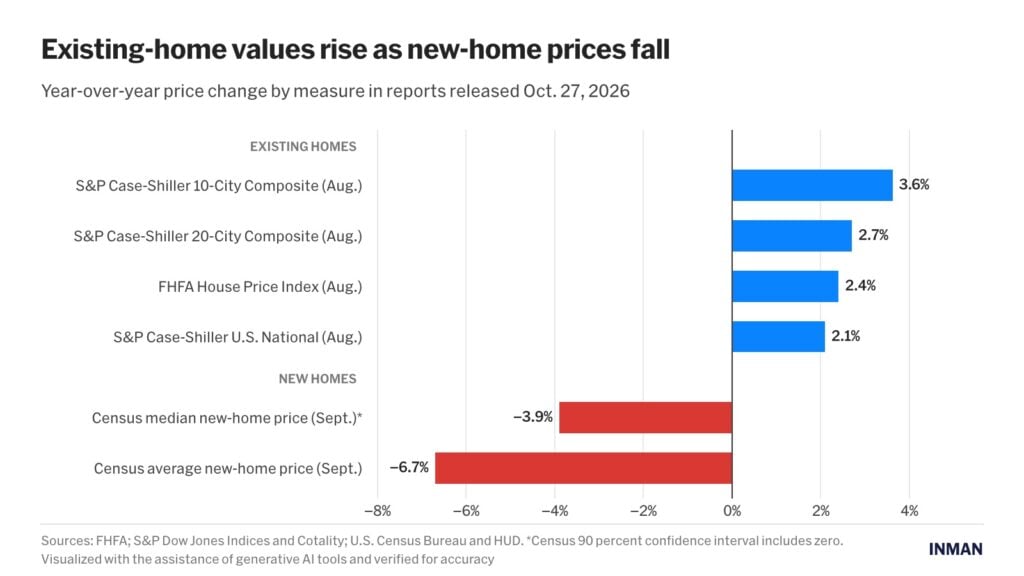
New-home sales fell more than 5 percent from a year earlier in September, while existing-home values rose more than 2 percent in August, according to three housing reports released Tuesday that show new-home prices falling as resale prices continue to climb.
The Federal Housing Finance Agency (FHFA) House Price Index rose 2.4 percent year over year in August, and the S&P Cotality Case-Shiller U.S. National Home Price Index rose 2.1 percent. Sales of new single-family homes ran at a seasonally adjusted annual rate of 676,000 in September, 5.3 percent below a year earlier, according to estimates from the U.S. Census Bureau and the Department of Housing and Urban Development (HUD). The median new-home price fell 3.9 percent to $400,400, and the average fell 6.7 percent to $472,800.
First American Deputy Chief Economist Odeta Kushi said the median new-home price has been below the median existing-home price for seven consecutive months, which she called “a reversal of the historical pattern in which new construction typically commands a premium.” She put September’s gap at $17,100, based on National Association of Realtors data.
“Builders are meeting buyers’ budgets with price cuts, financing incentives and smaller, more affordable homes,” Kushi said in a statement. “That is helping sustain sales, but it also shows how hard builders are working to keep buyers engaged.”
By the numbers
- 2.4 percent: annual gain in the FHFA House Price Index in August
- 2.1 percent: annual gain in the S&P Cotality Case-Shiller U.S. National Home Price Index in August
- 5.3 percent: annual drop in new-home sales in September (Census Bureau)
- 6.7 percent: annual drop in the average new-home price in September (Census Bureau)
- 43 percent: share of builders cutting prices in October (NAHB)
September new-home sales trail last year as builders cut prices
September’s sales pace was 0.6 percent below August’s revised rate of 680,000, according to the Census Bureau. Kushi said sales exceeded forecasts of 653,000.
“The better-than-expected result showed resilience despite rising mortgage rates, as builders continued using price flexibility and financing incentives to attract buyers,” she said.
Sales for the first nine months of 2026 ran 2.9 percent behind the same period last year. The Census Bureau said the annual and monthly changes in September were not statistically significant, meaning the survey’s margin of error includes the possibility of no change. The decline in the average price was statistically significant.
A larger share of new homes sold at lower price points. Homes priced below $400,000 made up 51 percent of new-home sales in September, up from 46 percent a year earlier, while homes priced at $1 million or more fell to 4 percent of sales from 6 percent, according to the Census Bureau. Kushi said some of the price decline reflects the shift toward smaller homes.
NAHB’s monthly builder survey points to the same pressure. Forty-three percent of builders cut prices in October, the highest share during the 2020-2026 period, and 65 percent offered sales incentives, according to the National Association of Home Builders (NAHB)/Wells Fargo Housing Market Index. Builder confidence fell to 29, its lowest reading since June 2012, and NAHB said buyer traffic is at its lowest level since April 2012, excluding the onset of the pandemic.
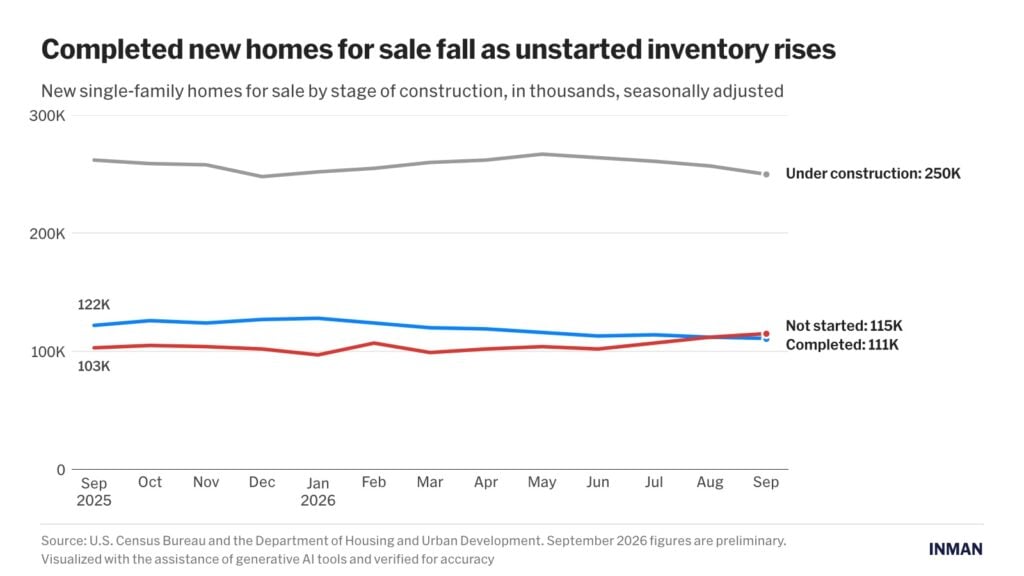
Builders had 476,000 new homes for sale at the end of September, down 1 percent from August, representing an 8.4-month supply at the current sales pace. Completed homes for sale fell to 111,000 from 122,000 a year earlier, which Kushi said is the lowest level this year. Homes for sale that builders had not yet started rose to 115,000 from 103,000. Completed new homes had been for sale a median of 3 months since completion in September, up from 2.4 months a year earlier, according to the bureau.
“Still, elevated supply continues to give buyers negotiating room and keeps pressure on builders to remain competitive,” Kushi said.
FHFA: Gains led by the Midwest and Middle Atlantic
U.S. house prices rose 0.3 percent from July to August, according to FHFA, which revised its July gain down to 0.2 percent from 0.3 percent. The index uses purchase-only data from Fannie Mae and Freddie Mac.
Annual gains ranged from 0.5 percent in the Mountain division to 4.4 percent in the East North Central division, which includes Illinois and Ohio. The Middle Atlantic, which includes New York, rose 4.3 percent, and the East South Central, which includes Tennessee and Kentucky, rose 3.9 percent. The South Atlantic and West South Central divisions, which include Florida and Texas, rose 1.3 percent and 1.4 percent.
Monthly changes ranged from a 0.8 percent decline in New England to a 2.1 percent gain in the East South Central division.
Case-Shiller: Annual growth picks up, trails inflation
The Case-Shiller national index’s 2.1 percent annual gain was up from 1.9 percent in July. The 10-city composite rose 3.6 percent, up from 3.4 percent, and the 20-city composite rose 2.7 percent, up from 2.5 percent. The national index stands 9.3 percent above its June 2022 peak.
S&P Dow Jones Indices said home values fell in real terms for the 15th consecutive month, with consumer prices up 3.4 percent from a year earlier.
The national index fell 0.2 percent from July before seasonal adjustment and rose 0.3 percent after it.
“The divergence suggests that the typical post-summer slowdown is obscuring some underlying strength in home prices,” said Rebecca Kaufman, associate director of commodities at S&P Dow Jones Indices.
Where the reports line up
The price indexes show the same regional split. Chicago led Case-Shiller’s metro indexes for the sixth consecutive month with a 6.7 percent annual gain, followed by New York at 6.2 percent and Cleveland at 4.3 percent, matching FHFA’s two strongest divisions. Seattle posted the largest annual decline for the third consecutive month at 2 percent. Las Vegas fell 1.3 percent, Dallas and Denver each fell 0.8 percent and Tampa fell 0.4 percent.
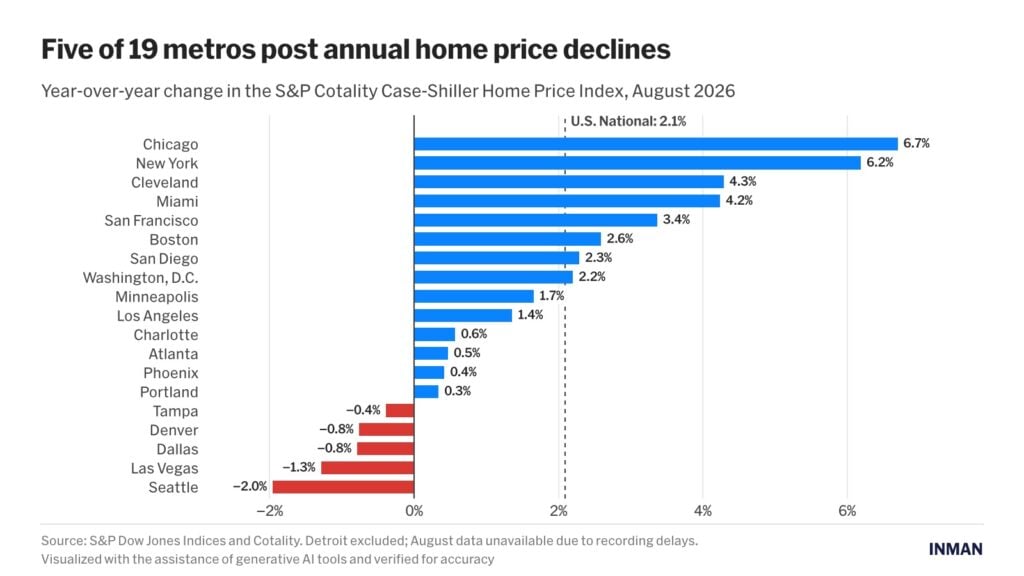
Prices in Tampa, Denver and Dallas were also lower than three years earlier, based on S&P’s three-year annualized returns for those metros.
New-home sales in the West fell 17.4 percent from a year earlier, according to the Census Bureau, though the bureau’s margin of error for that figure includes zero. NAHB’s three-month average builder sentiment readings ran from 40 in the Midwest to 26 in the West.
The average 30-year fixed mortgage rate was 7.32 percent as of Oct. 22, up from 6.19 percent a year earlier, according to Freddie Mac.
“Builders have kept sales moving by adjusting prices, offering incentives and bringing more lower-priced homes to market,” Kushi said. “But with buyer traffic at a multi-year low and mortgage rates above 7 percent, those strategies may become harder to sustain without further concessions.”