- Single-family rental growth has slowed in the high-end tier as of May, while the lower end of the market has remained strong throughout the nation, at 5.3 percent annual growth.
- In June 2016, the Home Price Index increased 2.6 percent in District of Columbia on an annual basis, and the monthly uptick was 1.5 percent.
- D.C. had one of the nation's highest rates of foreclosure inventory in June, at 2 percent.
CoreLogic’s Market Pulse for August 2016 reports on the national market and local trends, including a new inside look at the rental sector. Similar to the data company’s CoreLogic Home Price Index (HPI) and CoreLogic Case-Shiller Index, the new Single-Family Rental Index (SFRI) measures the growth of the rental market since January 2007.
After a massive growth spurt at the tail end of 2009 and into 2011 and steady growth that continued for a few years after, the SFRI shows rental price gains have recently begun to soften.

Rent growth peaked at 4.6 percent in December 2014 over the previous year, but as of May, the growth rate was 1.2 percent lower, at an annual uptick of 3.3 percent. Following a similar pattern to that seen in the homebuying market, the rental market has seen a slow-down in the high-end sector as of recently, while lower price points are holding their own.
Rent prices at the lowest end of the spectrum were up 5.3 percent in May over the previous year, marking a three-year growth trend around 5.5 percent. At the high end of the market, rentals were up 2.1 percent annually.
Current housing market trends
Boomerang buyers — homebuyers returning to the market after losing a foreclosed home — have slowly but surely made their way back into the real estate market. Looking ahead to 2017, the return of boomerang buyers has the potential to be strong, the report says.
CoreLogic reports the year is nearing seven years from the foreclosure crisis peak in 2010, which means that the ‘black mark’ of foreclosure will be officially erased from consumer credit reports.
CoreLogic reports on the hardest hit locations for boomerang buyers that returned by 2013. The three highest states for boomerang buyers — Arizona, Nevada and Michigan — saw 32 percent of its foreclosed homeowners come back to action in the market, compared to a 22 percent national average.

Using CoreLogic property tax and sale transaction data linked to a randomly selected group of one million individuals who went into foreclosure between 2000 and 2013. The cumulative return rates of foreclosed homeowners is shown below, considering the time between 2008 and 2011.
Nationally, the foreclosure rate in June 2016 was 3 percent lower than the previous month and 21.3 percent lower than the same month in 2015. Completed foreclosures increased 5.1 percent monthly in June and dipped 4.9 percent annually in the same month.

The foreclosure rate in Washington D.C. was among the highest in the nation in June, at 2 percent. All northeast coast states have a reported high foreclosure inventory rate except for New Hampshire, according to the report.
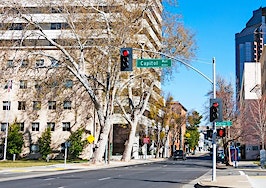
D.C. market trends

In the District of Columbia, home price growth is moderate and expected to continue at the same rate for the next year, CoreLogic says. Annually in June 2016, the Home Price Index increased 2.6 percent. The monthly uptick was 1.5 percent, which is relatively strong for a month-over-month change.
That growth is expected to slow but continue to climb, CoreLogic says. The CoreLogic month-to-month forecasted growth for D.C. is 0.4 percent, and the predicted year-over-year change is 3.8 percent.