
Since we began tracking the data for the major metropolitan statistical areas (MSAs) in 1981, there has never been a better time to buy a home. The median-income household needs only 27 percent of their income (an all-time low) to qualify for the median-priced home, and that household is also only paying 3.3 times their income for the house (3.1 is the all-time low).
While we acknowledge that there is a tremendous demand/supply imbalance that will probably drive prices lower, long-term-oriented homebuyers have the opportunity of a lifetime in most markets around the country. Phoenix is clearly one of those markets. New York clearly is not. Do prospective buyers in most markets really want to gamble that prices AND mortgage rates will be cheaper next year, or can they take a longer-term view that it doesn’t get much better than this?
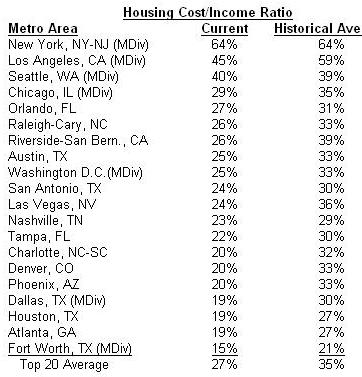
The table below shows the comparison between the current and historical average housing cost/income ratio for the top 20 resale markets in the country. All markets are below the average, with the exception of New York, which is currently at its average, and Seattle, which is slightly above average.
Our grading system of the economy and the housing market is a "bell curve" model, with statistics at an all-time high receiving an "A," statistics near the long-term average receiving a "C," and the worst times ever receiving an "F." In this grading system, it is OK to be a "C" student.
Here is our current report card:
Economic Growth: D
Real GDP (gross domestic product) fell to an annual rate of -6.2 percent, which was the most significant decline since mid-1980. The employment sector is also quickly deteriorating, losing 4.3 million jobs in the last year. The 3.1 percent year-over-year decline in employment is the largest in 50 years. The headline unemployment rate has increased to 8.1 percent, reaching its highest level since 1983, and the real unemployment rate is 14.8 percent (including part-time workers looking for full-time work). Mass layoff events — job cuts of more than 50 jobs — have risen 51 percent in the last year. Inflation continues to decline, with the Full CPI (consumer price index) now at 0 percent and the Core CPI (all items less food and energy) reaching 1.7 percent.
Leading Indicators: D-
The leading indicators declined further this month, pointing to an extended period of economic weakness in the near future. In February, stocks generally experienced double-digit percentage declines compared to January and resulted in year-over-year losses of between 39-45 percent for each of the four major stock indices we track. Homebuilder stocks were once again battered, declining 49 percent year-over-year. The price of crude oil has fallen quickly since September, and that trend continued in February as the average price per barrel reached just $39.16 in February. Adjusted for inflation, oil prices are back to early 2004 levels. The Leading Economic Index improved slightly from the previous month, but the negative growth rate of -3.3 percent suggests further weakness in the economy for the near-term. Despite the small uptick in January’s value of the Purchasing Managers Index, it remains near its lowest point since the early 1980s, indicating continued contraction in both the manufacturing sector and overall economy. …CONTINUED
Affordability: C+
Affordability continues to quickly improve due to declining home values and falling mortgage rates. However, strict lending standards, job loss fears and fear of further declining home values have kept many potential buyers on the fence. Mortgage rates continue to fall, reaching their lowest level in nearly 40 years. The 30-year fixed mortgage rate was at 5.07 percent at February month-end. The Fed’s overnight lending target rate remains at a range of 0 percent to 0.25 percent, which is the lowest level on record, with the intention of kick-starting the economy and battling deflation. The Mortgage Bankers Association reported a slight increase in the share of adjustable-rate mortgage (ARM) applications, which reached 2.4 percent in the last week of February, but is still extremely low when compared to peak levels above 35 percent of total loans in early 2005.
Consumer Behavior: D-
Consumer confidence continues to weigh heavily on the economy. The Conference Board’s consumer confidence index — currently at just 25 — reached its lowest level in the 41-year history of the index. The Consumer Sentiment Index also declined in February, yet the Consumer Comfort Index increased slightly this month. As consumers cut back on spending, the personal savings rate continues to improve, gaining 5 percent year-over-year for a total of $546 billion in savings.
Existing-Home Market: D
The existing-home market remains weak due to steep price declines and weak sales volume. The median price in the resale market has fallen nearly 15 percent year-over-year to $170,300, according to the National Association of Realtors (NAR), while the Case-Shiller index shows an annual decline in paired sales of more than 18 percent. The annualized existing-home sales volume declined to 4.5 million transactions in January, down from 4.7 million in December, and down 8.6 percent year-over-year, according to the NAR. The volume of pending home sales declined sharply in January, and is now 6 percent lower than one year ago, which suggests sluggish sales activity for the near future. The supply of unsold homes increased slightly to 9.6 months of inventory, which remains high compared to history.
New-Home Market: F
The new-home market continued to show signs of weakness in the past month. Builder confidence increased slightly this month, yet remains near historical lows, as the Housing Market Index increased to a value of 9. The median new-home price fell in January and is now down 13.5 percent year-over-year, equal to $201,100, according to the Census Bureau. The annualized new-home sales volume also fell sharply in January to 309,000 transactions, declining 48 percent year-over-year, and reaching the lowest level since the Census began tracking this data in 1963. While the absolute volume of unsold new homes continued to decline, falling sales activity pushed the months of supply to more than 13 months.
Housing Supply: F
The overall supply of new housing diminished across the board, from permits to starts to completions, continuing to push housing supply to extremely low levels. The annual volume of new-home completions fell to 1.01 million units, which was down 24 percent year-over-year. Both single-family and multifamily starts declined, pushing total starts down to 466,000 units. Single-family permits declined, and multifamily increased slightly, resulting in a nearly 51 percent year-over-year drop in total permit activity. The homeowner vacancy rate increased slightly in the fourth quarter to 2.9 percent — matching a record-high level.
John Burns is the founder of Real Estate Consulting in Irvine, Calif., which monitors changes in real estate market conditions and provides consulting services, including strategic planning, market research and financial analysis. He can be reached at jbrec@realestateconsulting.com.
Copyright 2009 John Burns
***
What’s your opinion? Leave your comments below or send a letter to the editor.
