
For much of the past two years, some regions were on the leading edge of the real estate market’s sole promising trend: an increasing openness from potential homesellers to test the waters.
Now, they’re among places experiencing the sharpest pullbacks in newly listed homes for sale.
Major population centers in Florida and Colorado that had once benefited from new waves of home listings have joined supply-constrained markets along the Pacific coastline in weighing down the nation’s inventory recovery, according to an Inman Market View tool update based on new data from Realtor.com.
- Annual growth in new listings slowed to less than 3 percent during the three-month period ending in October, down from the 7 percent annual growth rate recorded in the preceding three months.
With Inman’s interactive maps and charts below, you can explore whether your market is participating in this slowdown — or see if it’s bucking the trend, for now.
Click into one of the 500 local markets in the tool above, or search for an option from the dropdown menu for an even more detailed look at the data. Select different metrics and time-period comparisons for a fuller picture.
A drag on listings
As recently as the spring of this year, markets like Denver were seeing an especially robust recovery in newly listed residential properties. Around the same time a year earlier, a number of Florida markets were experiencing similar year-over-year gains of 20 percent or more.
But these places are now coming back down to Earth.
- The number of new listings that hit the market from August through October in the greater Miami area was almost 7 percent lower than the same period last year.
- In Denver, new listings were down nearly 5 percent year-over-year over the same period.
It’s not just former new-listing gainers that are weighing down the national trend today.
A number of West Coast markets are also posting year-over-year declines in new inventory. And many of these — such as Portland, Oregon — have been well below normal levels for years.
- In Portland, the number of newly listed properties from August through October was 32 percent below pre-pandemic levels for that time of year.
- New listings in Miami were 14 percent below pre-pandemic norms, and Denver listings were 17 percent below normal — both roughly in line with the national numbers.
Zooming in
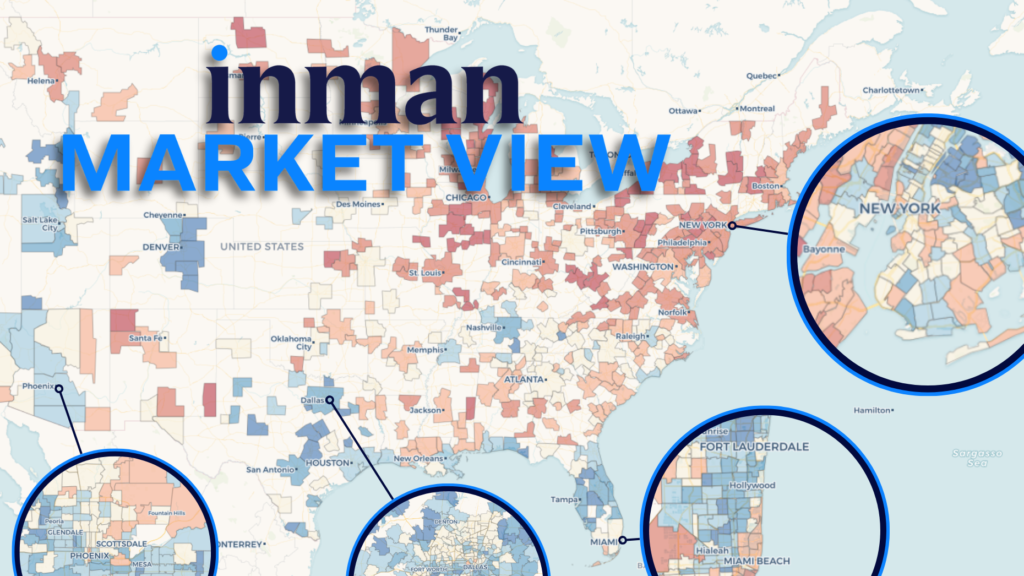
One benefit of the Inman Market Explorer map is its ability to drill down deep within any of the 500 featured markets to see which zones are contributing most to the trends in question.
Below, zoom in, drag and hover over different ZIP codes to see which Miami areas have seen the biggest year-over-year declines in new listings from August through October.
We see that in Miami’s case, the listing declines have been broadly felt across the greater metro area, with some particularly strong dropoffs in Miami proper and along the coastline.
To take a similar view of your market, search for it from the dropdown menu, or click the blue “Return to National View” button and navigate from there.
Inman updates these tools each month with new data, so keep an eye out for future installments in this series.