Check Inman every day for the daily version of this market roundup.
Day-by-day market activity:
Thursday, June 29
Q2 2017 U.S. Median Home Price at Least Affordable Level Since Q3 2008

- The U.S. median home price of $253,000 in the second quarter of 2017 was at the least affordable level since Q3 2008, a nearly nine-year low in affordability.
- The national home affordability index was 100 in the second quarter of 2017, the lowest national affordability index since Q3 2008, when the index was 86, and meaning the share of average wages needed to buy a median-priced home nationwide was on par with its historic average (see full methodology in graphic above).
- The report also shows that 210 of 464 U.S. counties analyzed for the index (45 percent) were less affordable than their historic affordability norms in the second quarter of 2017 — the highest share of markets less affordable than their historic norms since Q4 2009.
- Nationwide the median home sales price in the second quarter of 2017 was $253,000, up 7.7 percent from a year ago — the biggest annual increase since the Q1 2014.
- Since bottoming out nationwide in Q1 2012, median home prices nationwide have increased 69 percent while average weekly wages have increased 9 percent during the same time period.
- Nationwide in Q2 2017, buying a median-priced home required 31.8 percent of average wages.
“While home price appreciation in the second quarter accelerated to the fastest pace in more than three years, wage growth turned negative, posting the biggest year-over-year decrease in five years in Q4 2016 — the most recent average weekly wage data available,” said Daren Blomquist, senior vice president at ATTOM Data Solutions. “That combination of accelerating home price growth and slowing wage growth, along with mortgage interest rates that are up nearly 50 basis points from a year ago, eroded home affordability nationwide to the lowest level in nearly nine years, and pushed the highest share of markets beyond the threshold of normal affordability in nearly eight years.”
30-Year Fixed Mortgage Rate Hits New Low

- 30-year fixed-rate mortgage (FRM) averaged 3.88 percent with an average 0.5 point for the week ending June 29, 2017, down from last week when it averaged 3.90 percent. A year ago at this time, the 30-year FRM averaged 3.48 percent.
- 15-year FRM this week averaged 3.17 percent with an average 0.5 point, the same as last week. A year ago at this time, the 15-year FRM averaged 2.78 percent.
- 5-year Treasury-indexed hybrid adjustable-rate mortgage (ARM) averaged 3.17 percent this week with an average 0.5 point, up from last week when it averaged 3.14 percent. A year ago at this time, the 5-year ARM averaged 2.70 percent.
“The 30-year mortgage rate fell 2 basis points to 3.88 percent this week,” said Sean Becketti, chief economist, Freddie Mac. “However, the majority of our survey was conducted prior to Tuesday’s sell-off in the bond market which drove Treasury yields higher. Mortgage rates may increase in next week’s survey if Treasury yields continue to rise.”
Tuesday, June 27
- The 30-year fixed mortgage rate on Zillow Mortgages is currently 3.67 percent, down one basis point from this time last week. The 30-year fixed mortgage rate rose to 3.71 percent on Friday, then hovered there before falling to the current rate on Tuesday.
- The rate for a 15-year fixed home loan is currently 2.95 percent, while the rate for a 5-1 adjustable-rate mortgage (ARM) is 2.96 percent.
- Below are current rates for 30-year fixed mortgages by state.

“Mortgage rates were flat last week and we expect the relative calm to continue leading up to the Fourth of July holiday,” said Erin Lantz, vice president of mortgages at Zillow. “Lenders are likely to price conservatively going into the holiday weekend. A couple of Fed speeches midweek could push small movements in rates, but overall we expect another quiet week.”

- The S&P CoreLogic Case-Shiller U.S. National Home Price NSA Index, covering all nine U.S. census divisions, reported a 5.5 percent annual gain in April, down from 5.6 percent last month.
- The 10-City Composite annual increase came in at 4.9 percent, down from 5.2 percent the previous month.
- The 20-City Composite posted a 5.7 percent year-over-year gain, down from 5.9 percent in March.
- Seattle (12.9 percent), Portland (9.3 percent) and Dallas (8.4 percent) reported the highest year-over-year gains among the 20 cities.
“As home prices continue rising faster than inflation, two questions are being asked: why? And, could this be a bubble?” said David M. Blitzer Managing Director and Chairman of the Index Committee at S&P Dow Jones Indices. “Since demand is exceeding supply and financing is available, there is nothing right now to keep prices from going up. The increase in real, or inflation-adjusted, home prices in the last three years shows that demand is rising. At the same time, the supply of homes for sale has barely kept pace with demand and the inventory of new or existing homes for sale shrunk down to only a four- month supply. Adding to price pressures, mortgage rates remain close to 4% and affordability is not a significant issue.”
CoreLogic Housing Credit Insights, Q1 2017


- In Q1 2017 the HCI increased to 105.6, up 3.6 percent from the prior year. While underwriting slightly loosened, the underlying risk factors in Q1 remain in the same range as the last four years when loans exhibited very good mortgage performance.
- The slight loosening in the credit index was partly due to a shift in the mix of loans to purchase originations which exhibit higher risk than refinances.
- The average credit score for homebuyers increased 7 points year over year between Q1 2016 and Q1 2017, rising from 734 to 741.
- Holding steady at 36 percent, the average DTI for homebuyers in Q1 2017 was similar to Q1 2016.
- The LTV for homebuyers fell by 1.7 percentage points between Q1 2016 and Q1 2017 from 87.6 percent to 85.9 percent.
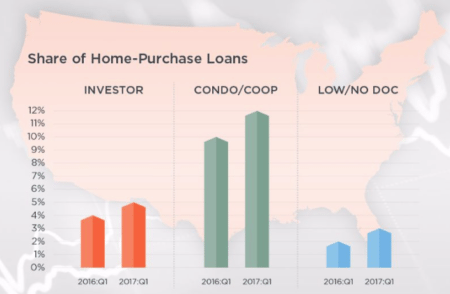
- The investor share of home-purchase loans increased from 4 percent in Q1 2016 to 5 percent in Q1 2017, and the share of home-purchase loans secured by a condominium or a co-op building increased from 10 percent in Q1 2016 to 12 percent in Q1 2017.
- The five states with the highest average original credit score of borrowers was District of Columbia (758), Hawaii (754), New York (750), California (749) and Colorado (749).
- Applications in the lower credit score range are almost non-existent in 2016 when compared to 2006. Applicants may be “self-removing” themselves from the applicant pool. This may explain some of the decline in new-loan credit risk.
“Mortgage rates during the first quarter of 2017 were up about 0.5 percentage points from a year earlier,” said Frank Nothaft, chief economist at Core Logic. “Since 2009, for every one-half percentage point increase in mortgage rates, the average credit score on refinance borrowers has dipped by 9 points, and this pattern will likely continue if mortgage rates move higher. That is because when rates rise, applications drop off and loan officers spend more time with the applicants that have less-than-perfect credit scores, require more documentation or have unique property issues.”
Monday, June 26
- Real house prices decreased -1.6 percent between March and April.
- Real house prices increased by 11.0 percent year-over-year
- Consumer house-buying power, how much one can buy based on changes in income and the interest rate, increased 0.4 percent between March and April, and fell 4.5 percent year-over-year.
- Real house prices are 33.6 percent below their housing-boom peak in July 2006 and 10.8 percent below the level of prices in January 2000.
- Unadjusted house prices increased by 5.7 percent in April on a year-over-year basis and are 2.6 percent above the housing boom peak in 2007.
“Despite the monetary tightening policies of the Federal Reserve, a dip in the average rate for a 30-year, fixed-rate mortgage and wage gains increased consumer house-buying power sufficiently to offset the gain in unadjusted house prices. The decline in real, purchasing-power adjusted house prices between March and April was the largest month-over-month decline since July 2016,” said Mark Fleming, chief economist at First American. “While this is welcome news for home buyers, the number of homes listed for sale is not meeting consumer demand and markets are getting tighter. As a result, affordability declined 11 percent on a year-over-year basis. That’s a bigger drop in affordability than the 5.7 percent caused by unadjusted house-price appreciation alone and reflects the impact of rising interest rates and tightening supply.”
Email market news to press@inman.com.