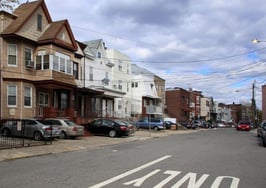
Several U.S. neighborhoods in designated opportunity zones have been identified as ripe for housing development opportunities in a special joint report released by Attom Data Solutions and Seattle-based proptech company CityBldr.
The report highlights 11 opportunity zone neighborhoods with the greatest potential for taking advantage of opportunity zone tax benefits in order to revive densely packed, low-income communities. CityBldr identified these particular areas as places where both the community and housing developers have the most to gain from these tax benefits, based on both machine learning technology and a detailed understanding of these housing markets.
The 11 neighborhoods that are the best candidates for opportunity zone investment include:
- Anacostia — Washington, DC
- South Shore — Chicago, Illinois
- City Heights — San Diego, California
- Mid-City — Los Angeles, California
- Parramore — Orlando, Florida
- Central District — Seattle, Washington
- West Colfax — Denver, Colorado
- Spartan Keyes — San Jose, California
- North End/New Center — Detroit, Michigan
- Buckman/Kerns — Portland, Oregon
- Hilltop — Tacoma, Washington
Although most of these neighborhoods have significantly lower income and educational levels, as well as higher percentages of renters than homeowners, than the U.S. as a whole, a few do have above-average educational levels and most of these areas have home values that exceed the national median home price.

Bryan Copley | CityBldr
“This data tells us that housing developers should consider investing in these neighborhoods because they have an immense amount of potential, plus tax benefits aimed at realizing that potential,” Bryan Copley, co-founder and CEO of CityBldr, said in a statement. “What we’ve done with this study is create a standardized score to compare every opportunity zone in the U.S. to determine which areas would yield the highest average return on investment.”
Median household income in seven of these areas is below $40,000, and all 11 areas are beneath the national median of $61,937. All 11 neighborhoods have poverty levels higher than the national rate of 13.1 percent, ranging from 16.3 percent in the Mid-City neighborhood of Los Angeles to 49.4 percent in San Diego’s City Heights neighborhood.
A whopping 53 to 98 percent of households rent homes in these neighborhoods, in contrast to the 36 percent of households that rent nationwide. Detroit’s North End/New Center neighborhood has the lowest rental rate, while Orlando’s Parramore neighborhood has the highest rental rate.
In most of the 11 neighborhoods, the percentage of adults with college degrees ranges widely, but remains below the national level of 32.6 percent, from 3.6 percent in Parramore to 31.5 percent in Denver’s West Colfax neighborhood. However, in San Jose’s Spartan Keyes (37.5 percent of adults), Seattle’s Central District (48.7 percent) and Portland’s Buckman/Kerns (56.5 percent), rates of adults with college degrees sit above the national level.
Although overall economic distress levels remain relatively high in these neighborhoods, in eight out of 11 of these areas, the typical home sells for more than the national median home sales price, according to Attom data from the first half of 2020. The lowest median home prices are in Detroit’s North End/New Center at $40,501, and the highest are in San Jose’s Spartan Keys at $885,000.

Todd Teta | Attom Data Solutions
Detroit’s North End/New Center (median home prices up 25 percent), Orlando’s Parramore (up 31 percent) and Chicago’s South Shore (up 91 percent) saw the greatest increases in median home prices from the first half of 2019 to the first half of 2020. Meanwhile, the largest year over year declines in median home prices were seen in San Jose’s Spartan Keys (down 7 percent), Los Angeles’ Mid-City (down 12 percent) and Tacoma’s Hilltop (down 32 percent).
“Factoring in home values and how they’ve done in the past year adds a critical piece of data to the picture,” Todd Teta, chief product officer with Attom, said in a statement. “Developers can get a demographic snapshot of what these areas look like, plus the hard numbers on how home prices are changing.”