This post has been republished with permission from Smaulgld.com.
- U.S. individual bankruptcy filings have fallen to their lowest levels since 2008.
- Delinquencies and percentage of consumers in collections are also declining.
- Yet consumer debt is increasing.
- U.S. consumer debt at $3.3 trillion is up 29 percent from $2.55 trillion at the end of the “Great Recession.”
- The U.S. consumer is tapped out.
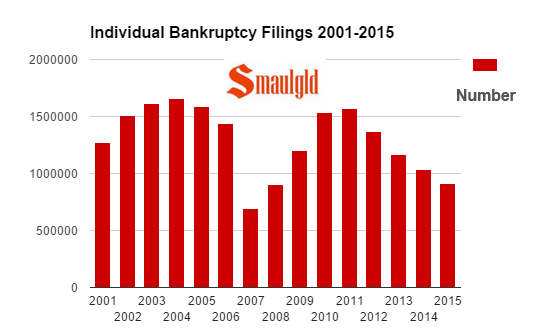
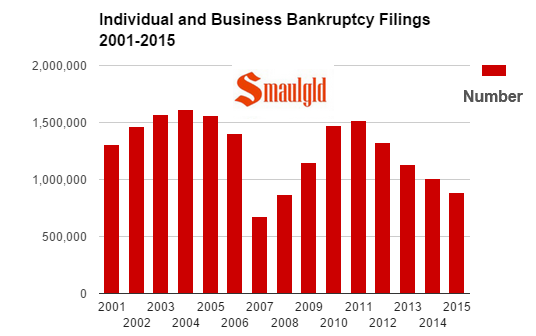
Individual bankruptcy filings, 2001-2015
U.S. individual bankruptcy filings are at multiyear lows, as are delinquencies and the percentage of consumers in collection. After the Internet bubble burst in 2000, individual bankruptcy filings increased from 2001 and peaked in 2004 at 1.65 million before bottoming out in 2007 at 695,575.
After the financial crisis of 2008, bankruptcy filings soared from 2009 and peaked in 2011 at 1.57 million. The most recent data from the United States courts for the period ended March 31, 2015, shows individual bankruptcy filings at 911,086, their lowest level since 2008, when there were 901,927 individual filings.
Delinquencies and collections fall
Delinquencies for credit card, mortgage, home equity lines of credit (HELOCs) and auto loans have all declined since 2008 — although auto loan delinquencies have ticked up in recent months.
Student loan delinquencies, however, have risen sharply.
The percentage of American consumers with debt in collections has also declined since 2008, and the percentage of American households who have credit card debt from month to month has declined from 44 percent in 2009 to 34 percent in 2014.
Low interest rates, relatively low consumer inflation and job (but not wage) growth have enabled an increasing percentage of Americans to avoid delinquent payments and collections.
Yet lower interest rates have also encouraged consumers to take out an increasing amount of consumer debt.
Are bankruptcy filings set to soar again?
While the decline in bankruptcy filings might appear to bode better economic times, it doesn’t. People go bankrupt when their income and assets cannot meet their outstanding expenses and debt obligations. If debt obligations continue to increase while income doesn’t, bankruptcy is inevitable unless that trend can be reversed.
The housing bust of 2008/2009 caused a spike in bankruptcy filings that tailed off as many consumers repaired their credit and rebuilt their savings (with the help of rising home prices and a booming stock market). For many others, however, the low interest rates instituted by the Federal Reserve since 2009 have encouraged many consumers to borrow and spend and spend.
Consumer credit-fueled spending has exploded nearly 30 percent since 2009. While credit card debt has declined, auto, student loan and stock margin debt have all soared.
The pattern of lower bankruptcy filings and increased consumer credit from 2009-2015 is following a near identical pattern as consumer behavior after the dot-com bust from 2001-2008; as consumers come out of bankruptcy, they load up again on increasing amounts of debt.
Economists expecting that second-quarter and second-half 2015 U.S. gross domestic product (GDP) will get a boost from increased consumer spending or a rise in home sales should note that the U.S. consumer, while seemingly better able to keep the collection man at bay and is no longer filing for bankruptcy at record rates, is overloaded with debt and tapped out.
Further, higher insurance, rent and fuel costs and lack of wage growth will keep a lid on spending. Because consumers have borrowed to go to school, buy cars while paying higher rent and insurance premiums as their wages stagnate, new- and existing-home sales remain at depressed levels.
New-home sales 1963-2015
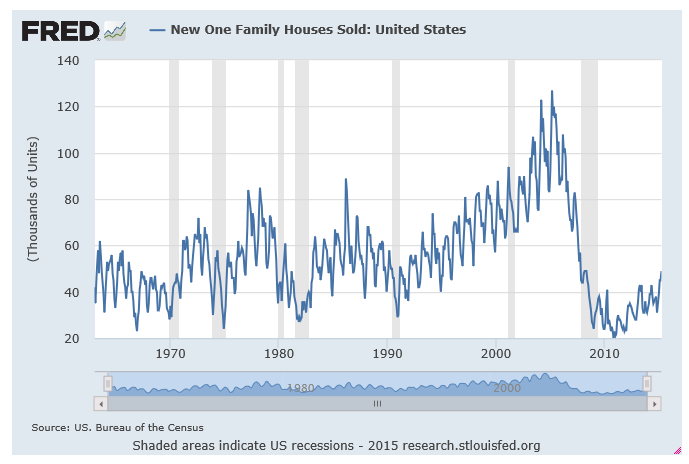
For underwater homeowners higher home prices may have provided some relief, but for potential new homeowners, higher home prices have made homes unaffordable and have acted as a drag on sales.
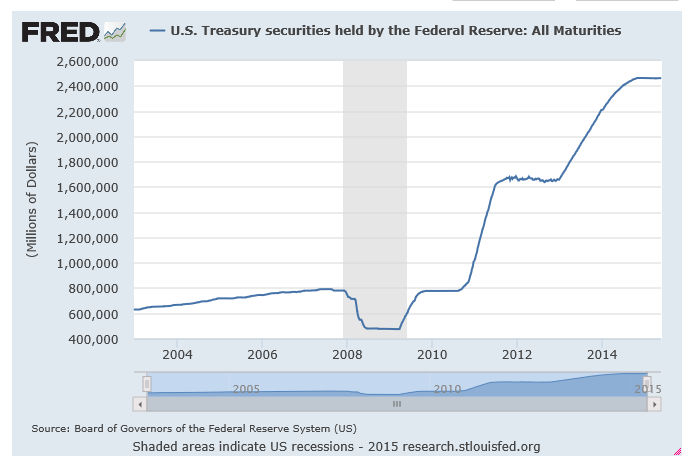
The chart below from the St. Louis Federal Reserve shows the growth in consumer credit.
Total consumer debt: $3.3 trillion

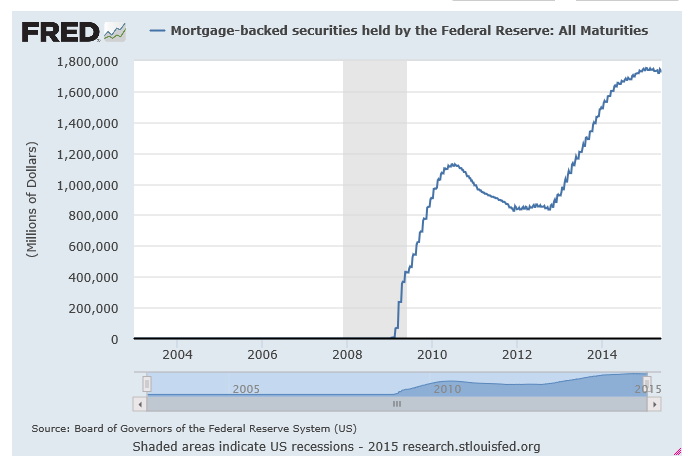
Size of the Federal Reserve balance sheet: $4.23 trillion
The massive $3.3 trillion U.S. consumer credit debt is $930 billion less than the value of the Federal Reserve’s holdings of U.S. treasuries and mortgage-backed securities that they “bought” during three iterations of quantitative easing, totaling $4.23 trillion.
Outstanding U.S. consumer credit
Here are the major sources and amounts of U.S. consumer credit.
Student loans: $1.355 trillion
Average student loan debt: $32,956
As college has become more expensive and more people have gone to college, the amount of debt accumulated to finance a college education has increased. At the end of the first quarter of 2015, the outstanding amount of U.S. student loan debt was $1.355 trillion, up from $363 billion in 2005.
Job prospects of college graduates have been subpar since the end of the Great Recession in 2009. As a result, many recent college graduates have struggled to make their student loan payments. At the end of 2014, the delinquency rate of student loans was 11.3 percent.
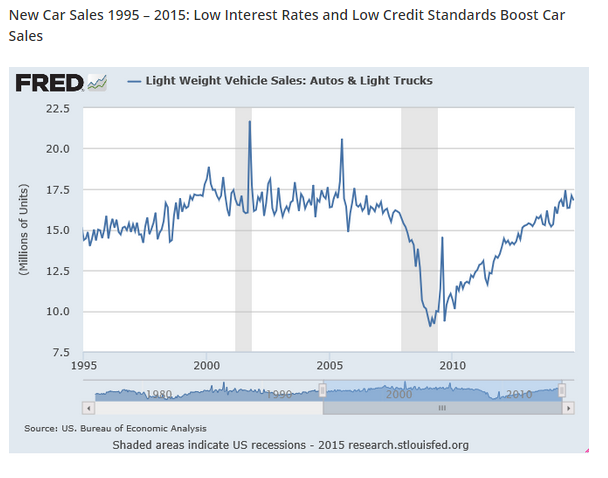
Auto loans: $972.4 billion
Average auto loan debt: $17,508
While home sales have stagnated during the past four years, car sales driven by easy credit have surpassed their prerecession peaks. Outstanding auto loans increased 36 percent from $713.5 billion in 2010 to $972.4 billion in 2015. Much of this growth is from subprime borrowers. According to Structured Finance News, the average FICO score of the borrower was 552, and 13 percent had no score!
Subprime delinquency rates on borrowers with credit scores below 601 have risen to 5.19 percent in the first quarter of 2015 from 5.14 percent last year. According to credit reporting bureau TransUnion, more than 71 million consumers had a loan or lease in the first quarter of 2015.
The average auto loan debt increased for the 16th straight quarter to 3.8 percent in the first quarter of 2015 from last year to $17,508, according to TransUnion.
Auto loan delinquencies rose to 3.5 percent at the end of 2014, compared with 3.1 percent at the end of 2013.
Credit card debt: $889.4 billion
Average credit card debt: $15,609
Credit card debt has declined since the end of the Great Recession in 2009 but has been on the upswing since 2011.
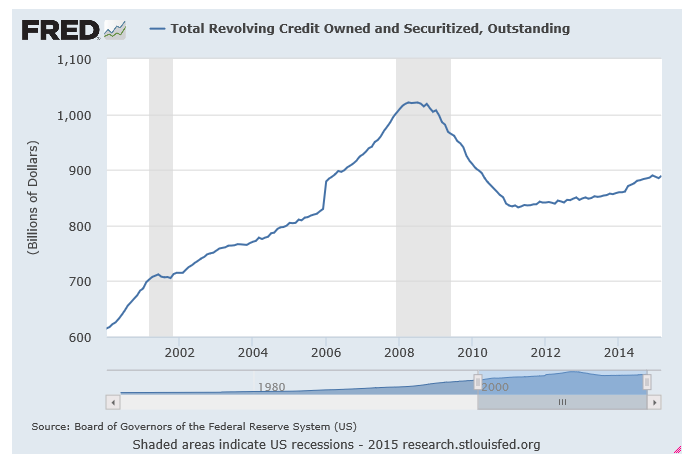
Credit card debt is on the rise again.
Stock account margin debt: $476 billion
As stocks hit new highs, so do margin account balances. At the end of the first quarter of 2015, according to the New York Stock Exchange, margin debt was $476.4 billion, up from from $464.9 billion at the end of February. The current $476.4 billion stock market margin debt is a record far exceeding the prior record of $384.37 billion set in July 2007.
In March 2014, Dallas Federal Reserve President Richard Fisher called the then-record-approaching stock market margin debt “eye popping” and warned, “We must monitor these indicators very carefully so as to ensure that the ghost of ‘irrational exuberance’ does not haunt us again.”
Stock margin debt has increased more than $80 billion since Mr. Fischer made his remarks.
Home mortgage debt: $8.2 trillion
Average home mortgage debt: $156,706
Home sales since the end of the great recession have stagnated, and the homeownership rate has declined. A substantial minority of homes in the United States since 2010 have been purchased with cash.
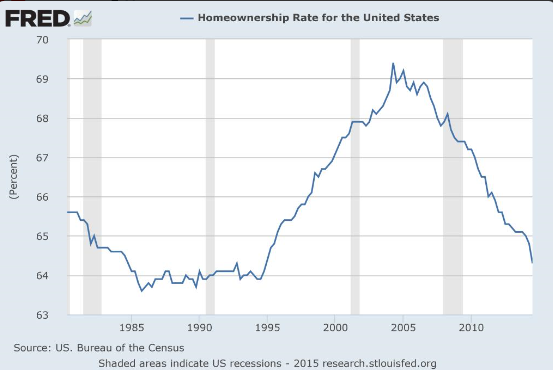
Foreclosures and higher prices have caused a decline in the homeownership rate.
Home equity lines of credit: $265 billion
The housing mortgage bubble burst in 2008/09 and caused a tidal wave of foreclosures for a few years. As foreclosures from the housing bubble of the mid-2000s subside a new wave of defaults relating to that bubble may be only the way. In the mid-2000s, more than 10 million homeowners who purchased at the top of the market from 2005-2008 took out home equity lines of credit (HELOCs).
Many HELOCs enter the repayment phase after 10 years, and the HELOCs taken out in 2005 will be coming due this year. Monthly payments on these loans often triple or quadruple. An increase in the size of HELOC payments will certainly strain the household finances of those holding these types of loans and curb their spending and in many unfortunate cases, cause bankruptcy.
Appendix:
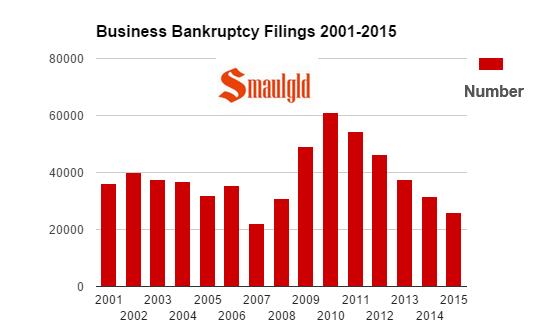
Business bankruptcy filings 2001-2015
Individual and business bankruptcies 2001-2015
Source: Bankruptcy filings
Source: Average credit card, mortgage and student loan debt
Source: Total consumer credit, auto and student loans
Louis Cammarosano is the author of Smaulgld, a blog that provides finance, economics and real estate market analysis, and marketing strategies and tips for real estate professionals.