Real estate business sentiment in recent weeks deteriorated to its lowest level since the government shutdown in November as agents reported sudden worsening of their client pipelines.
Agents reported in July a significant thinning of their client pipelines compared to the same time last year, especially on the seller side, according to results from the latest Inman Intel Index survey of real estate professionals.
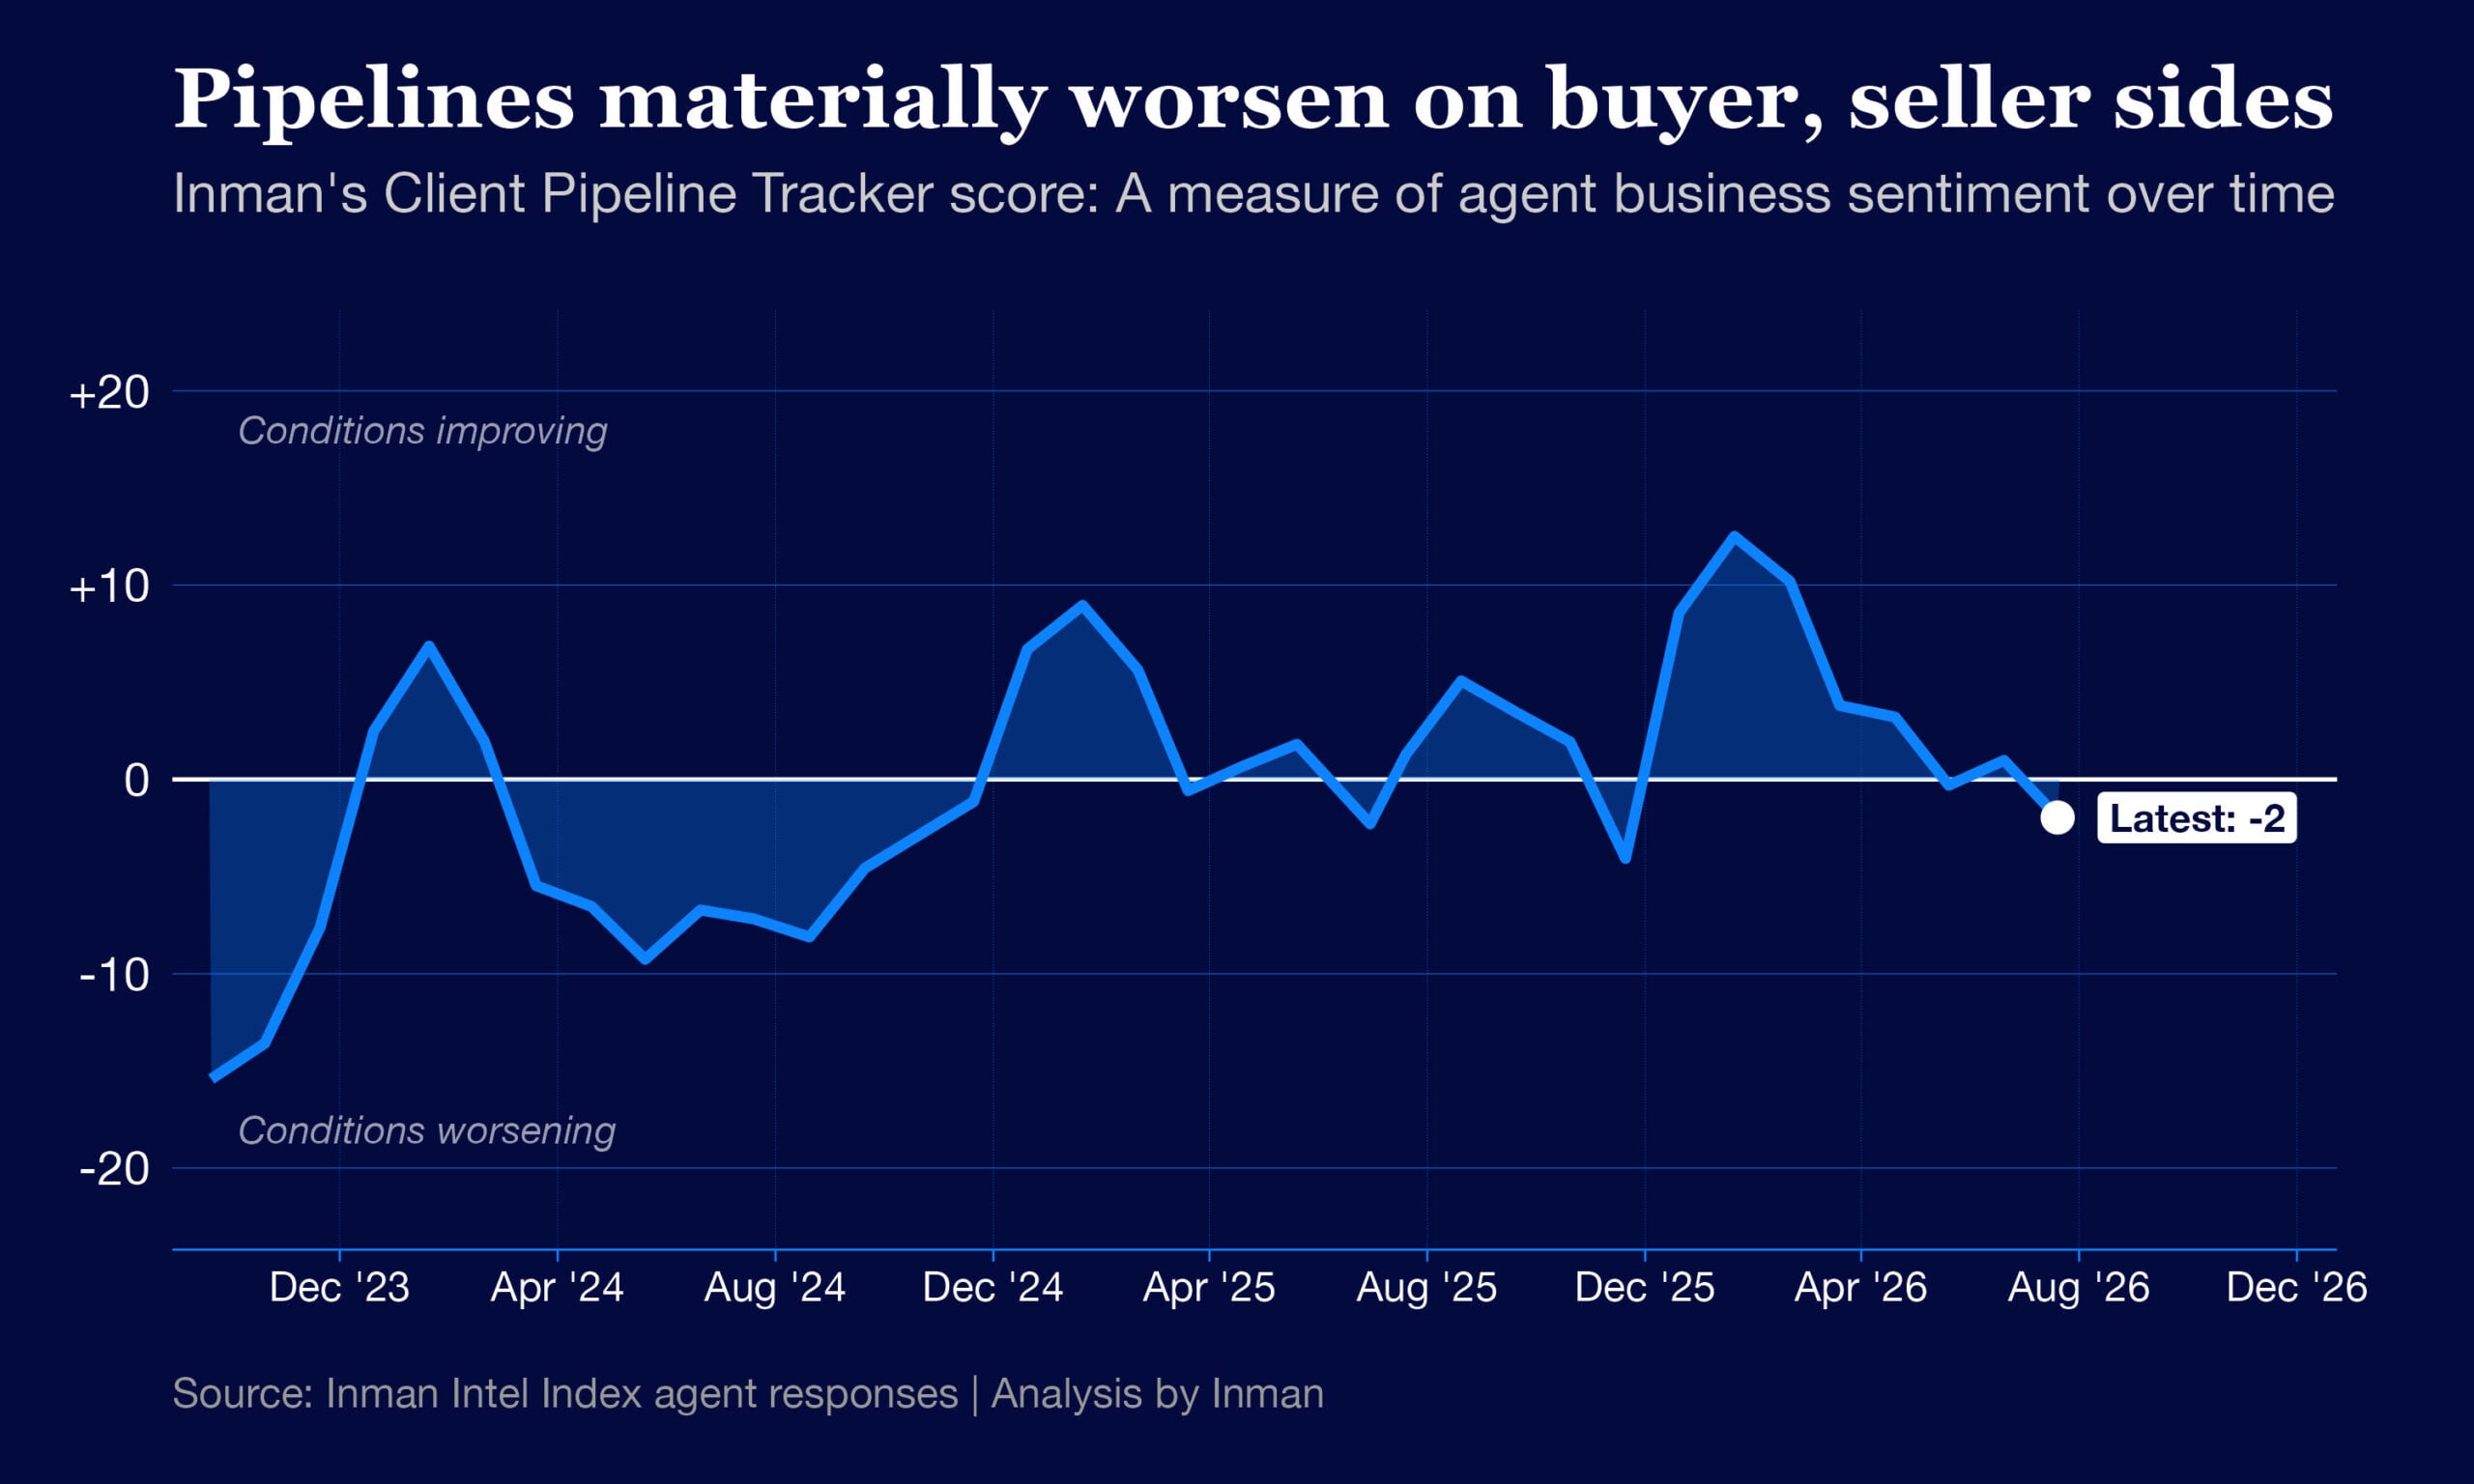
These reports pushed Inman’s Client Pipeline Tracker metric back into negative territory following the cautious optimism that abounded heading into the spring.
Client Pipeline Tracker score in July: -2
- Previous high point: +13 in January
- 12 months ago: +1 in July 2025
In recent months, the biggest drops in sentiment could be attributed to agents’ assessment of their future business prospects amid the war in Iran and elevated mortgage rates.
But this time around, the clearest culprit for the decline was the nature of the conversations — or lack thereof — that agents were having on the ground with prospective clients.
Read the full breakdown of the score’s four components in this week’s report.
A midsummer pullback
Inman’s Client Pipeline Tracker is a compilation of how agents feel about their buyer and seller pipelines — both over the past year and in the near future.
Inman described the methodology in this post, but here’s a quick refresher on how to interpret the scores.
- A score of 0 represents a neutral period in which client pipelines are neither improving nor worsening.
- A positive score reflects a market in which client pipelines have been improving, or are widely expected to improve in the next 12 months. The higher the rating, the more confident agents are that conditions are moving in a positive direction.
- A negative score suggests client pipeline conditions are worsening, or are widely expected to get worse in the year to come.
A significantly positive combined score falls around the +20 mark. This type of score would signify that much of the industry is in agreement that pipelines are improving and will continue to improve.
A significantly negative combined score, on the other hand, falls closer to -20. That’s a bit lower than where the industry stood in September 2023, the first time Inman surveyed agents about their pipelines.
For each of the four individual components that go into the score, results as high as +50 or as low as -50 are sometimes observed.
Here are the component scores from the most recent survey, and how each sentiment category changed from the previous one.
Tracker component scores
June → July
- Present buyer pipelines: -20 → -26
- Future buyer pipelines: +8 → +6
- Present seller pipelines: -6 → -14
- Future seller pipelines: +8 → +8
Back in March and May, when the Tracker score saw significant declines, it was largely explained by how agents had adjusted their expectations for the year ahead.
But by July, the decline in sentiment is very much rooted in the present.
- The share of agent respondents who reported thinner listing pipelines than at the same point last year jumped from 33 percent in June to 41 percent in July.
- From December through June, the highest share reporting year-over-year declines in these seller-client pools was 35 percent.
And the mid-summer decline wasn’t limited to the seller side.
- From June to July, the share of agent respondents who reported year-over-year declines in buyer pipelines jumped from 43 percent to 49 percent.
- That’s also the highest level of buyer-side pipeline thinning reported since November, in the wake of a government shutdown that temporarily sent agent sentiment downward.
Interestingly, these changes to actual client pipelines don’t appear to have budged outlooks for the year ahead all that much.
- The share of agents with an optimistic outlook for their buyer pipelines in the year ahead dipped slightly from 32 percent in June to 29 percent in July.
The listing pipeline trend was more complex, with fewer agents reporting extreme negativity, but also fewer expecting to be able to sustain current listing prospect levels.
These diverging trends offset each other in the Tracker score, resulting in no change from month to month in seller-side outlook.
Inman will continue to track these trends for Select Advantage subscribers in the months ahead, providing an early window into the conditions that underpin the lifeblood of agent commissions: a healthy, growing client pool.
Methodology notes: This month’s Inman Intel Index survey ran from July 21-28, and received 635 responses. The entire Inman reader community was invited to participate, and a rotating, randomized selection of community members was prompted to participate by email. Users responded to a series of questions related to their self-identified corner of the real estate industry — including real estate agents, brokerage leaders, lenders and proptech entrepreneurs. Results reflect the opinions of the engaged Inman community, which may not always match those of the broader real estate industry. This survey is conducted monthly.