Reposted with permission from Mike DelPrete.
It’s not easy to measure agent productivity. There’s no magic number to compare one agent against another, nor to measure one brokerage against another.
True agent productivity — selling more houses for more money faster than the competition — is multidimensional and nuanced, influenced by technology, the market and brokerage operating models.
Compass has invested tens of millions of dollars into technology over the years and has claimed its agents are more productive than its peers, in no small part due to its technology platform. “One of Compass’ competitive advantages is that every employee has a singular focus on agent productivity,” its CEO told Barron’s in 2018, while later claiming agents saw a 25 percent boost in transactions in their first year.
Using four methods of analysis, this research study aims to provide a deeper look at Compass’ agent productivity compared to its industry peers.
Research note: This analysis utilizes data from the Real Trends 500, which ranks the largest real estate brokerage firms in the U.S. by sales volume and transaction count, in addition to my own independent research. To be fair to Compass and account for its massive growth during 2019 (8,000 to 15,000 agents), this analysis uses a midpoint agent count (11,500) for all 2019 calculations.
Defining productivity
Agent productivity is a function of two inputs — the number of transactions closed and the average home price — which produces an agent’s sales volume (the total value of homes sold in a year).

Average home price is a variable that’s difficult to change, and it’s highly dependent on the market. The number of transactions per agent is a result of many factors; one would expect efficiency gains made through technology to show up here. To measure productivity, we must look not only at sales volume, but also the number of transactions an agent closes.
Method 1: Production
The most commonly accepted method of evaluating — and comparing — the relative productivity of real estate agents is sales volume: the total value of homes sold during a period of time. This metric, called production, translates directly to income, paid as commissions. The more revenue an agent generates, the more productive they are.
The following chart looks at the 20 largest U.S. brokerages by total sales volume during 2019, ranked in order of average sales volume per agent. On a per-agent basis, Compass ranks near the top for average agent production.

Evaluating agent productivity based on sales volume provides a broad basis for comparison, but it misses several nuances. As outlined above, total sales volume is heavily influenced by the type of market an agent operates in. Agents operating in a luxury market can sell fewer houses and achieve a high sales volume.
Sales volume per agent is a great metric to track how much revenue an agent generates — and arguably what a brokerage cares about most — but it doesn’t fully capture the efficiency nor productivity of an agent. Those factors, which can be enhanced by technology or a unique operating model, requires deeper analysis.
Method 2: Transactions
The number of transactions an agent closes in a year is another measure of agent productivity. One could argue that a more efficient agent — supported by technology — would be able to close more deals, faster.
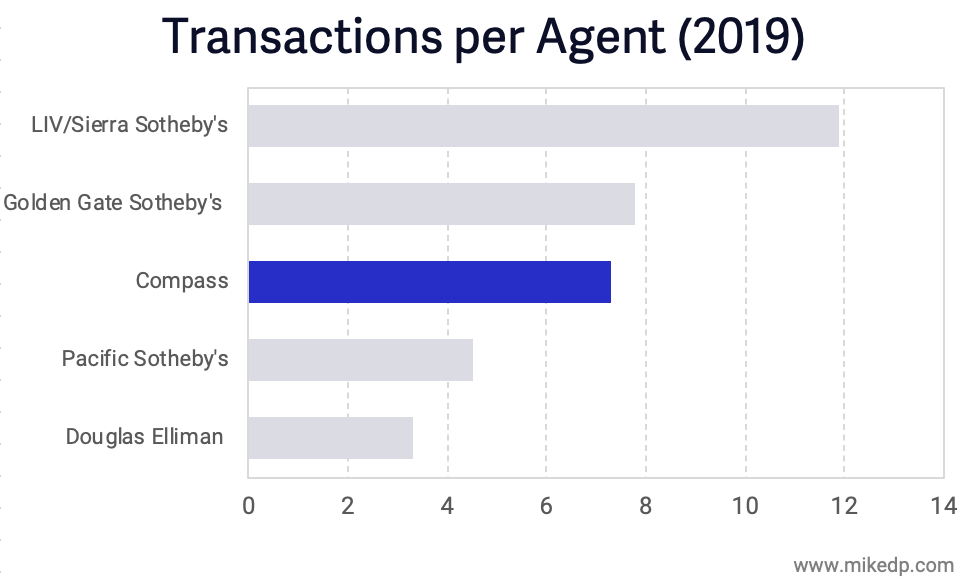
The following chart looks at the 20 largest U.S. brokerages based on total transaction count, ranked by the average number of transactions closed per agent. Redfin, with a unique operating model employing salaried agents, is the clear outlier. Compass is in the middle of the pack with an average of 7.4 transactions closed per agent in 2019.

Benchmarking Compass against the average number of transactions closed per agent at the 20 largest brokerages, the 20 largest brokerages excluding Redfin, the four largest brokerages, and the two largest brokerages, shows Compass agents slightly below average.

Simply looking at transaction counts fails to account for the relative price points of homes in different markets. While an agent in a high-end market might close fewer transactions, it might be a result of higher priced homes that take longer to sell, rather than overall efficiency.
Plotting both the average number of transactions and the average sales volume per agent again reveals Redfin as the outlier, while Compass is clustered with its high-end peers.

Compass agents clearly produce a high sales volume, but overall efficiency as measured by transactions per agent reveals Compass agents to be slightly lower than the industry average.
Method 3: High-end peers
The average sales volume per agent is heavily influenced by average home prices. High-end agents, doing fewer transactions each year, have a disproportionately higher sales volume due to high home prices. This makes it difficult to compare productivity at a high-end brokerage such as Compass, with an average home price of $1.1 million, to a mid-market brokerage such as Howard Hanna, with an average home price of $225,000.
One method to solve for this is to “freeze” the average home price in our equation, by only comparing Compass to its high-end peers. The following brokerages have average home prices similar to Compass, +/- $200,000 in value.

The average sales volume per agent at these five brokerages shows Compass in the middle of the pack in terms of agent productivity. On average, Compass agents are neither more nor less productive than their up-market peers.

Looking at the other measure of efficiency, the average number of transactions per agent, similarly reveals Compass to be in the middle of the pack. On a per-transaction basis, compared to its high-end peers, Compass agents are on average — neither higher- nor lower-performing.
Method 4: Itself
Ultimately, perhaps the best peer comparison for Compass is itself. If “every employee has a singular focus on agent productivity,” one would assume improvements are being made over time.
Between 2018 and 2019, the average sales volume per agent (using the same midpoint agent count calculations for each year) at Compass declined, from $9.1 million to $7.9 million.

Was Compass alone with dropping sales volumes per agent? The evidence suggests it (almost) was, with three out of its four high-end peers increasing their average sales volumes per agent during the same period.

Summary of evidence
It’s undeniable that Compass agents have a high average sales volume; more than twice that of industry behemoths Realogy and HomeServices of America. But it begs the $6.4 billion dollar question: Is it because of the agent or because of Compass?
There’s no easy answer when the question is agent productivity. The evidence above — coming from four different angles, and using all available information — suggests the following:
- Compared to the industry average, Compass agents generate a high sales volume.
- The high sales volume is driven by high home prices, rather than agent efficiency.
- Agent efficiency and productivity improvements, as a result of a sizable technology investment, have yet to materially manifest themselves.
Timing is a final, important consideration. As I outlined in an earlier analysis, the three eras of Compass, it was not until 2019 that the company’s technology investment truly matched its rhetoric.
Unrivaled technology investment to boost agent efficiency has been a key component of the Compass narrative and an important recruiting tool, but — through the end of 2019 — remains an aspiration rather than a clearly demonstrable reality.
Mike DelPrete is a strategic adviser and global expert in real estate tech, including Zavvie, an iBuyer offer aggregator. Connect with him on LinkedIn.