
In the closing days of 2024, the U.S. Senate Budget Committee released a novel report for those closely tracking how forecasts of extreme-weather events might already be affecting the housing market.
The dataset consisted of homeowner policy non-renewal rates from the nation’s largest insurers, a group accounting for nearly two-thirds of the market.
The release painted one of the clearest and most complete pictures yet of which areas of the country were increasingly being pinpointed by insurers in 2023 as uniquely vulnerable to changes in the climate, especially with regard to disasters like wildfires, floods and high-speed winds in the Great Plains.
Now, the Inman data team is combining these insights with government data on home prices and residential construction in an effort to assess whether — and to what extent — these pullbacks by insurers were a leading indicator for local housing markets.
Drill deep on what we learned, and the implications for your own market, in this interactive report.
Signal of risk
Insurance companies typically decline to renew homeowner policies at an extraordinarily low rate — significantly lower than 1 percent in most parts of the country.
But in dozens of counties, non-renewal rates ballooned to something like 10 times that high in the span of a few years from 2018 to 2023. And the committee’s data showed that the places where non-renewal rates rose fastest were the same areas that were exposed to greater risk from wildfires, hurricanes, flooding and other severe weather events.
Explore the interactive map below to see where non-renewal rates stood in 2023. Toggle the view to see the change from 2018.
We see that the areas where insurers had been increasingly reluctant to renew policies are clustered in the coastal Southeast, parts of California and the West that are especially prone to wildfires, and a smattering of counties throughout tornado alley in the central U.S.
The map above also supports the ability to see different housing metrics and how they’ve shifted since the Senate’s report came out.
To make sense of these numbers, it’s not enough to just look at what happened to construction and pricing in isolation. These places at greatest risk are concentrated within the Southern and Western regions of the U.S., where housing inventory has already significantly rebalanced and upward price pressure has stalled or reversed in many places.
But comparing the highest-risk counties to their peer localities from each region helps cut through some of this noise.
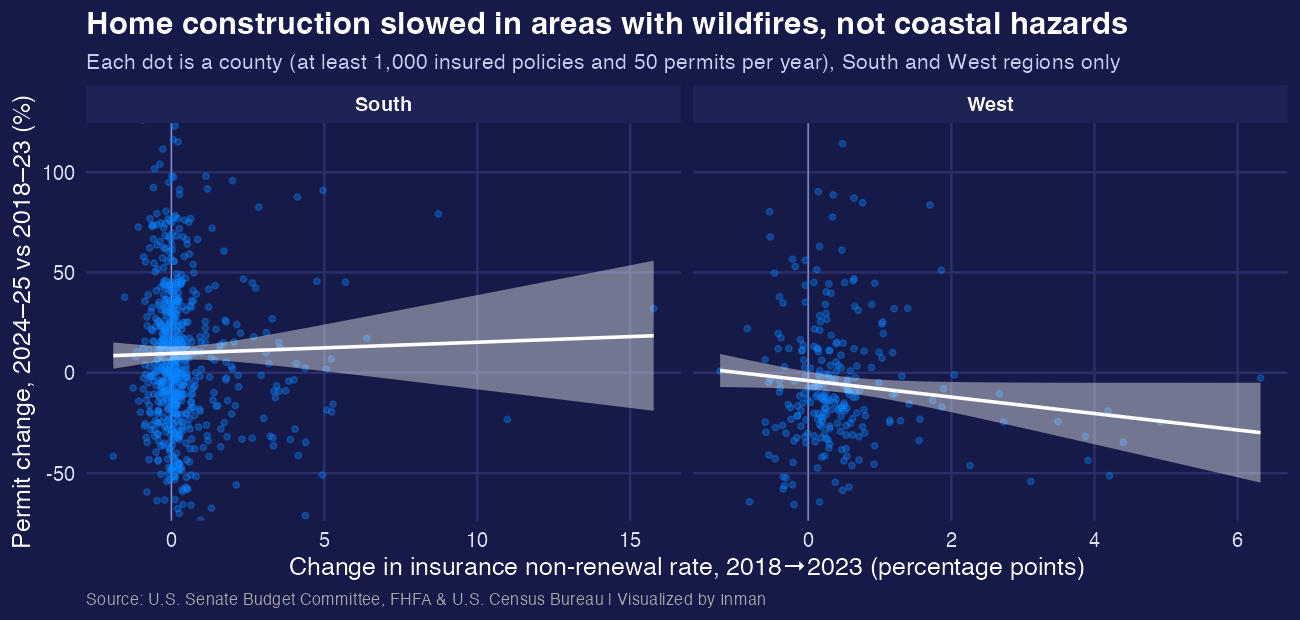
Homebuilders had not meaningfully slowed new projects in the coastal South where hurricane and flooding risk was increasingly dissuading insurers from renewing policies a few short years ago. In some cases, new permits have even gained steam in these areas.
But in some of the areas of the West where non-renewal rates were highest due to wildfire risk, builders do appear to have tapped the brakes.
Interestingly, when it comes to home-price growth, there is minimal effect observed in the West. But counties in the South — especially along or near the low-lying coastline — were likelier to see deceleration in home-price growth after insurers identified them as high-risk areas.
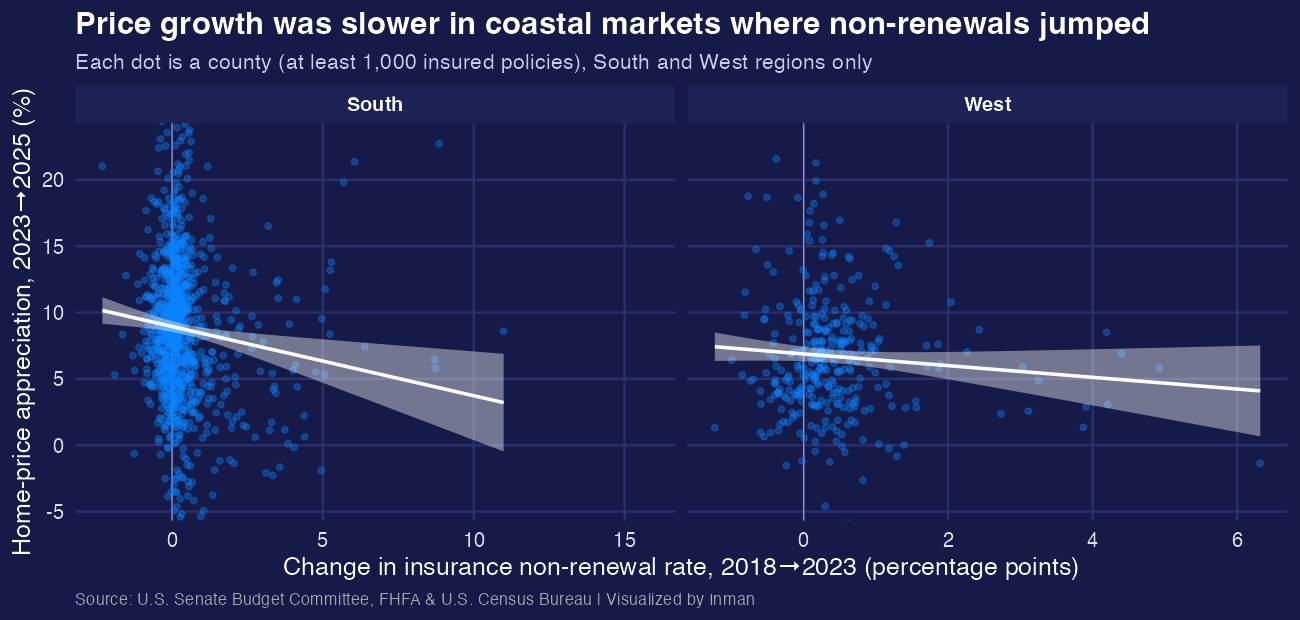
It’s worth noting that these relationships are only accounting for one significant variable: the region’s general trends with respect to inventory and building permits. This view doesn’t demonstrate that a relationship is caused by the same climate- and disaster-related factors that have prompted insurers to re-think whether some properties are insurable.
It’s also the case that the effects observed here are relatively modest, all things considered. But with only two years of data since the initial non-renewal dataset was released, it bears continuing to watch in the months and years ahead.
Explore the interactive tool above to dive deeper into your own market.