
The following is a list of additional data and charts provided by online real estate search, research and data companies:
- 2010 top 10 most searched real estate markets (Realtor.com)
- Top 10 states with shortest days on site: for-sale properties (Realtor.com)
- Top 10 fastest-moving markets on site in 2010 (Realtor.com)
- Top 10 MSAs: Fastest-rising median list prices in 2010 (Realtor.com)
- Inventory counts: MSAs with the fastest falling inventory counts in 2010 (Realtor.com)
- 2010 fastest-rising median list prices (Realtor.com)
- Markets with low price-to-income ratios (Zillow.com)
- Markets with low delinquency rates: November 2010 (CoreLogic)
- Markets poised to outperform in 2011 (Altos Research)
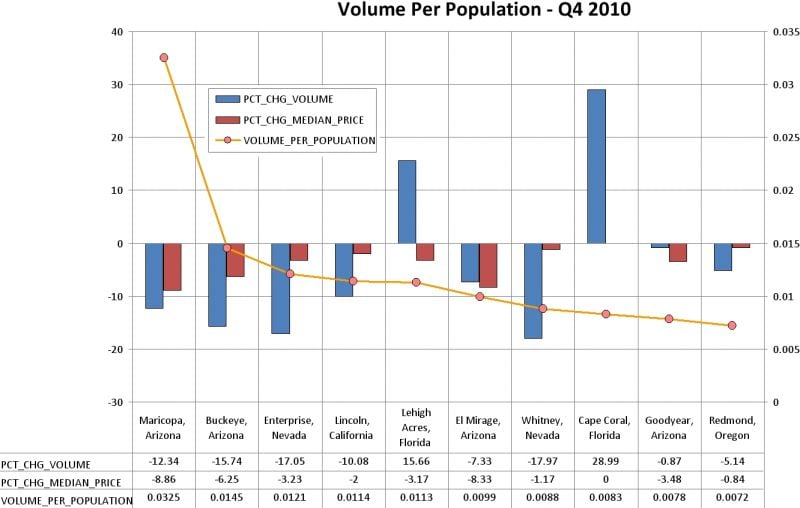
- Sales volume per population, Q4 2010 (Onboard Informatics)
- Percent change in sales, Q3 2010-Q4 2010 (Onboard Informatics)
- Percent change in median price, Q3 2010-Q4 2010 (Onboard Informatics)
- Top 10 U.S. markets for buying and investing in 2011 (RealtyTrac)
- Top 10 cities to buy vs. rent (Trulia)
- Top 10 cities to rent vs. buy (Trulia)
- Fastest-moving for-sale markets, January 2011 (HotPads)
2010 Top 10 Most Searched Real Estate Markets
1. Las Vegas
2. Los Angeles
3. Orlando
4. San Antonio
5. Miami
6. Phoenix
7. San Diego
8. Austin
9. Tampa
10. Chicago
Source: Realtor.com.
Monthly Data

Source: Realtor.com.
…CONTINUED
Top 10 states with shortest days on site (for-sale properties)
| State | Avg. days on site (Jan. ’10-Dec. ’10) |
| Alaska | 148.5 |
| Oklahoma | 153.8 |
| North Dakota | 158.2 |
| California | 161.7 |
| Nebraska | 166.3 |
| Texas | 173.8 |
| Washington | 185.7 |
| South Dakota | 187.2 |
| Kansas | 187.9 |
| Rhode Island | 189.2 |
Source: Realtor.com.
…CONTINUED
Top 10 fastest-moving markets on Realtor.com in 2010 (based on avg. # of days listings were displayed for sale on the site)
| MSA | Avg. days on site |
| Oakland, Calif. | 76 |
| Shreveport-Bossier City, La. | 91 |
| Merced, Calif. | 92 |
| Fargo-Moorhead, N.D.-Minn. | 94 |
| Anchorage, Alaska | 96 |
| Lincoln, Neb. | 96 |
| Stockton-Lodi, Calif. | 98 |
| Tulsa, Okla. | 101 |
| Bakersfield, Calif. | 103 |
| Modesto, Calif. | 103 |
| Rochester, N.Y. | 103 |
Source: Realtor.com.
…CONTINUED
Top 10 MSAs: Fastest-rising median list prices in 2010
| Rank | MSA | Median list price | Compound growth rate (%) |
| 1 | Fort Myers-Cape Coral, Fla. | $184,500 | 2.2% |
| 2 | South Bend, Ind. | $111,700 | 2.1% |
| 3 | Savannah, Ga. | $238,000 | 2.0% |
| 4 | Shreveport-Bossier City, La. | $160,700 | 1.7% |
| 5 | Buffalo-Niagara Falls, N.Y. | $139,000 | 1.7% |
| 6 | Trenton, N.J. | $268,000 | 1.6% |
| 7 | Columbia, Mo. | $169,500 | 1.5% |
| 8 | Washington, D.C.-Md.-Va.-W.V. (D.C.) | $369,000 | 1.3% |
| 9 | Fort Wayne, Ind. | $107,900 | 1.3% |
| 10 | Washington, D.C.-Md.-Va.-W.V. (Va.) | $343,900 | 1.2% |
Source: Realtor.com.
…CONTINUED
Inventory counts: MSAs with the fastest-falling inventory counts (2010)
| MSA | 1/1/2010 | 12/1/2010 | CAGR* |
| Queen Creek, Ariz. | 657 | 312 | -6.6% |
| Maricopa, Ariz. | 312 | 160 | -5.9% |
| Casa Grande, Ariz. | 180 | 96 | -5.6% |
| Apache Junction, Ariz. | 329 | 176 | -5.6% |
| Pooler, Ga. | 369 | 213 | -4.9% |
| Beverly Hills, Calif. | 469 | 273 | -4.8% |
| La Canada Flintridge, Calif. | 156 | 94 | -4.5% |
| Pacific Palisades, Calif. | 233 | 141 | -4.5% |
| West Hollywood, Calif. | 228 | 140 | -4.4% |
| Springfield, Ga. | 104 | 65 | -4.2% |
*compound annual growth rate
Source: Realtor.com.
…CONTINUED

Source: Realtor.com.
…CONTINUED
Markets with low price-to-income ratios
| MSA | Population | ZHVI* | Yr. over yr. | Current price/Income |
| Toledo, Ohio | 667,360 | $89,601 | -6.3% | 2.0 |
| Pittsburgh, Pa. | 2,404,190 | $107,134 | 0.2% | 2.3 |
| Pensacola, Fla. | 462,147 | $119,729 | -7% | 2.3 |
| Utica, N.Y. | 299,124 | $99,109 | 0% | 2.3 |
| Phoenix, Ariz. | 4,163,757 | $130,837 | -11.5% | 2.4 |
| Jacksonville, Fla. | 1,359,173 | $131,871 | -10.8% | 2.4 |
| Atlanta, Ga. | 5,322,915 | $132,860 | -12.9% | 2.4 |
| Rochester, N.Y. | 1,054,376 | $119,084 | -2% | 2.4 |
| Columbia, S.C. | 719,810 | $125,049 | 0.9% | 2.6 |
| Lincoln, Neb. | 291,904 | $132,099 | -3% | 2.6 |
| Winston-Salem, N.C. | 464,838 | $127,761 | -1.6% | 2.8 |
| Greensboro, N.C. | 691,871 | $128,024 | -1.6% | 2.9 |
| Raleigh, N.C. | 1,023,620 | $175,979 | -6.6% | 2.9 |
| Worcester, Mass. | 806,147 | $203,774 | -6.7% | 3.1 |
| Vallejo, Calif. | 426,952 | $210,966 | -0.1% | 3.1 |
| Hartford, Conn. | 1,203,355 | $216,858 | -2.3% | 3.2 |
| Naples, Fla. | 337,239 | $209,400 | -3.1% | 3.5 |
| Durham, N.C. | 477,119 | $172,183 | -1.2% | 3.5 |
| Poughkeepsie, N.Y. | 684,296 | $237,911 | -3.6% | 3.5 |
| Prescott, Ariz. | 218,514 | $183,876 | -8.1% | 4.2 |
*Zillow Home Value Index
Source: Zillow.com.
…CONTINUED
Markets with low delinquency rates: November 2010
| Metro area | Share of loans 90+ days delinquent |
| Austin-Round Rock-San Marcos, Texas | 3.5% |
| Omaha-Council Bluffs, Neb.-Iowa | 3.6% |
| Buffalo-Niagara Falls, N.Y. | 4.1% |
| Cambridge-Newton-Framingham, Mass. | 4.1% |
| San Francisco-San Mateo-Redwood City, Calif. | 4.1% |
| Rochester, N.Y. | 4.2% |
| Raleigh-Cary, N.C. | 4.3% |
| Colorado Springs, Colo. | 4.5% |
| Oklahoma City, Okla. | 4.6% |
| Honolulu | 4.7% |
Source: CoreLogic.
…CONTINUED
Markets Poised to Outperform in 2011
| MSA | Yr.-yr. ch. in inventory | Yr.-yr. ch. in price of new listings | Asking price | % price decreased |
| Honolulu | 23.5% | 4% | $746,884 | 23.7% |
| Aspen, Colo. | -4.8% | 3% | $1,585,853 | 29.3% |
| Charleston, S.C. | 28.6% | 22% | $359,051 | 30.2% |
| Maui, Hawaii | 6.9% | 8% | $841,792 | 30.4% |
| Ann Arbor, Mich. | -3.6% | 7% | $216,642 | 36.5% |
| Pittsburgh | 10.6% | 8% | $157,163 | 38.5% |
| San Jose, Calif. | 42.5% | 1% | $666,623 | 39.0% |
| New Orleans | -5.5% | 4% | $201,667 | 33.5% |
| Manhattan | 20.7% | -1% | $5,218,014 | 26.3% |
| Louisville, Ky. | 6.0% | 2% | $183,601 | 34.3% |
Source: Altos Research.
…CONTINUED

Data is for markets with 50,000-plus population.
Source: Onboard Informatics.

Data is for markets with 50,000-plus population, minimum 25 sales.
Source: Onboard Informatics.

Data is for markets with 50,000-plus population, minimum 25 sales.
Source: Onboard Informatics.
Data is for markets with 10,000-plus population.
Source: Onboard Informatics.

Data is for markets with 10,000-plus population, minimum 25 sales.
Source: Onboard Informatics.

Data is for markets with 10,000-plus population, minimum 25 sales.
Source: Onboard Informatics.
…CONTINUED

…CONTINUED
Top 10 cities to buy vs. rent
|
Rank |
City |
State |
Price to Rent Ratio |
|
1. |
Miami |
Fla. |
6 |
|
2. |
Las Vegas |
Nev. |
6 |
|
3. |
Arlington |
Texas |
7 |
|
4. |
Mesa |
Ariz. |
8 |
|
5. |
Ariz. |
8 |
|
|
6. |
Jacksonville |
Fla. |
8 |
|
7. |
Sacramento |
Calif. |
10 |
|
8. |
San Antonio |
Texas |
11 |
|
9. |
Fresno |
Calif. |
11 |
|
10. |
El Paso |
Texas |
11 |
Source: Trulia
Top 10 cities to rent vs. buy
|
Rank |
City |
State |
Price:Rent Ratio |
|
1. |
New York |
N.Y. |
31 |
|
2. |
Seattle |
Wash. |
24 |
|
3. |
Kansas City |
Mo. |
21 |
|
4. |
San Francisco |
Calif. |
21 |
|
5. |
Memphis |
Tenn. |
20 |
|
6. |
Los Angeles |
Calif. |
20 |
|
7. |
Fort Worth |
Texas |
19 |
|
8. |
Oakland |
Calif. |
18 |
|
9. |
Portland |
Ore. |
18 |
|
10. |
Albuquerque |
N.M. |
18 |
Source: Trulia
…CONTINUED
