Compare you market to hundreds of others with Inman Market View's interactive maps and charts
Compare your market to hundreds of others with Inman's interactive maps and charts
Compare your market to hundreds of others with Inman's interactive maps and charts

Here are 5 simple ways to improve your systems, market knowledge, skill set and visibility
It's not just the biggest inventory gainers that have seen their stream of for-sale homes slow. Some of America's most listing-starved metros are once again losing ground. Dive deeper with Inman Market View's interactive maps and charts
Real estate's Great Rebalancing has entered a new chapter — one in which this summer's biggest inventory engines have become a drag on active-listing growth in the fall
Markets that had been bright spots amid troubled times are now seeing new listings slow. Dive into the local data with Inman's recurring series of interactive maps and charts
In its recurring series of interactive maps and charts, Inman's data team brings hyperlocal listing data to real estate agents and brokerage leaders
New listing business has been one of the few bright spots for real estate agents in a down market, but that light dimmed a bit this summer. Dive into the numbers with Inman Market View
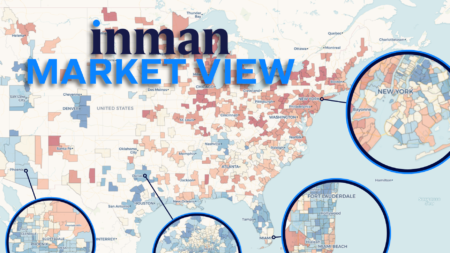
Extraordinarily detailed maps. Multi-market comparisons. Inman Market View takes another step forward — putting even richer visual data insights directly in the hands of real estate professionals

Mike Simonsen will lead the brokerage's market analysis and insights efforts. Simonsen stepped down from Altos in May

Opinion
Understanding technology adoption and service integration, Brandon Dobell of Brown Gibbons Lang & Company writes, will, in turn, unlock operational efficiencies and value creation