Editor’s note: This is the first installment of a four-part series that explores how the spread of neighborhood data will complicate the role of agents and aggravate residential segregation.
John Walko, a father of two who recently moved from Scranton, Pa., to a single-family rental in Charlotte, N.C., began his home search by filtering listings online based on location, price and photos — the fun stuff.
But as he continued to browse sites like Zillow and Trulia, he soon found himself digging through listings based on additional information: crime and school data.
“I wouldn’t have really thought of it too much,” he said of the crime maps and school data he discovered on the sites. “But now it stands out. Now you go, ‘Oh, I got to look at this, make sure it’s a safe community for my family.’ ”
In one case, Walko said he found a home that seemed like the perfect match, until he was alarmed by the crime data on Trulia.
“Then we thought, ‘Eh, I don’t want to worry about my car with all those break-ins.’ ”
Walko’s discovery shows how neighborhood information that appears front and center online can steer buyers and renters away from some localities and into others.
Increasingly, homebuyers are basing their real estate decisions on growing easy-to-access online data, undermining the traditional influence that real estate agents and marketers have had on real estate decision-making.
Real estate agents face this new fact-based consumer everyday. For example, many bristled after the listing portal RealtyTrac recently tacked the locations of sex offenders and toxic dumps onto its listing pages. Agents know how this plays out and reacted accordingly.
Imagine “putting red flags in every home near a sex offender,” said Steve Clarke, an Orem, Utah-based agent, about the RealtyTrac data rollout.
Indeed, the spread of data will make many agents’ lives more difficult, with buyers seizing on powerful statistics to quickly dismiss or latch onto areas or listings.
The social consequences of this data orgy are aggravating the economic and cultural divides that shape so many neighborhoods and cities.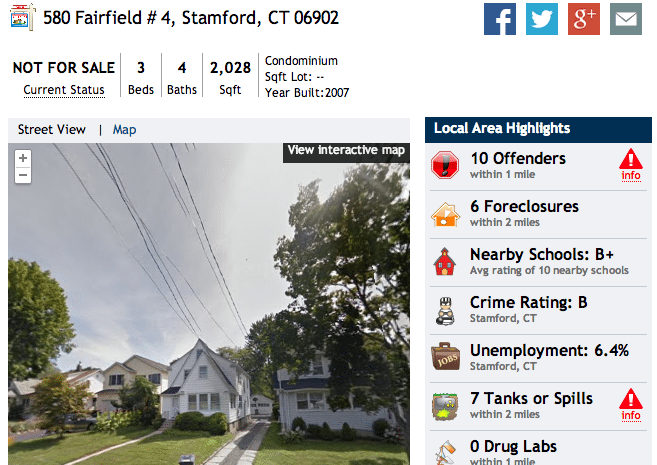
Screen shot of a property page on RealtyTrac-owned Homefacts.com showing data on sex offenders, schools, crime and other neighborhood characteristics. RealtyTrac recently added much of this data to its listing site, realtytrac.com.
The proliferation of hyperlocal data will exacerbate the historical trend of wealthy people settling in affluent neighborhoods, pushing the middle class into less high-end areas and forcing people in already distressed neighborhoods to cope with a diminishing tax base.
Beyond school ratings and crime data, more and more sites and apps are showing information like median income, political contributions, the percentage of families with children, and racial composition at a hyperlocal level.
Some of this data may undermine the spirit of fair housing laws, which have made many agents leery of disclosing information on protected classes like racial groups for fear of illegally steering them. It’ll also make it easier for people to sort themselves into communities based on their values and beliefs, feeding the growth of like-minded neighborhoods.
CensusConnect — an Internet browser plug-in that debuted at the beginning of last year but is no longer active — makes it easy to imagine how real estate services showing hyperlocal data could nudge buyers towards some listings and away from others.
By merely moving a cursor over icons on a listing result, people could see the locations of sex offenders, and the ethnic composition, homeowner-to-renter ratio, average household size, percentage of college graduates, and public assistance rate of each listing’s census block.

This screen shot taken in May 2013 shows two listing results on realtor.com supplemented with block-level demographic data by the browser plug-in CensusConnect. The plug-in no longer works because its creator found it too time-consuming to continually update.
The app, which obtained most of its data through the new Census Bureau application programming interfaces (APIs), offers a glimpse of the next-generation search tools that will likely serve up similarly precise neighborhood data.
Do you think hyperlocal data will alter the shape of some communities? Please share your thoughts in the comments section.
Calling open-source data a “double-edged sword,” Logan Powell, public affairs specialist at the Census Bureau, acknowledged that much of the APIs’ ultimate impact on people’s thinking depends on how companies choose to use them.
“We want people to use the data in the most scrupulous … and most careful way,” said Powell, who has led the Census Bureau’s effort in helping programmers use its APIs to surface census data. “How they mash it up is really up to them.”
Visualizing crime
Last year, Gina Ospina was considering moving to Providence, R.I. But she was only willing to take the plunge if she could find a neighborhood that’s safe.
To evaluate local crime levels, Ospina turned to NeighborhoodScout, a neighborhood site conveys crime risk more precisely than any other consumer site.
Reviewing a crime map, she quickly ruled out the west side of the city because of its relatively high crime rate. Zeroing in on the city’s east side, she then weeded out neighborhoods that were outside of her price range with the help of Trulia.
Ultimately, she was able to pinpoint an area at the southeastern region of the city that scored well on NeighborhoodScout’s crime meter and offered affordable apartments.
“I could see that the crime was located in certain areas and I could very easily stay away from those neighborhoods,” said Ospina, who did all of this research before even visiting the areas.
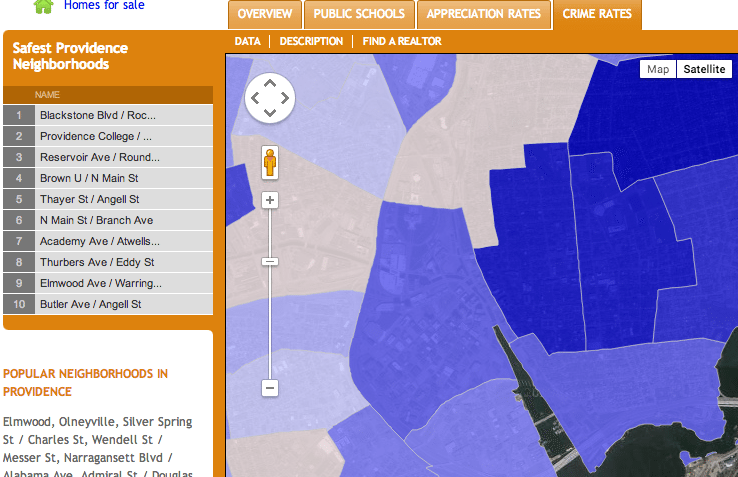
Gospina consulted an earlier version of this NeighborhoodScout heat map of Providence, R.I., to hone in on an area with relatively low crime rates in a southeastern region of the city (shown at the bottom-right corner of this screen shot).
Such data has proliferated in recent years, surfacing on sites devoted to displaying it, neighborhood information sites and listing portals.
One company already calculates hyperlocal crime rates that are extremely precise. Location Inc., the parent company of NeighborhoodScout, sells data to real estate investment trusts and insurance companies that show crime risk on a map down to a 10-meter spatial resolution, according to CEO Andrew Schiller.
“We’ve built more and more sophisticated predictive models based on massive meta-analysis at nearly every intersection in the United States,” he said.
The crime rates are so sharp that a shopping mall operator may use them to see how crime risk varies near different entrances.
Because Location Inc. would rather sell this data, the company only surfaces crime maps on NeighorhoodScout that show risk down to a census tract level, not a 10-meter spatial resolution. Census tracts generally contain anywhere from 1,200 to 8,000 people.
Unintentional redlining
Apps designed to help people steer clear of high-crime areas have ignited controversy in the past.
Microsoft came under fire after being granted a patent for a software intended for GPS devices that would help people avoid high-crime areas, dubbed “ghetto avoider” by some. And an app that debuted in the fall of 2013 called “Ghetto Tracker” triggered a backlash that led to its demise.
Critics of such apps argue that they are discriminatory because they tend to steer users away from low-income areas with high concentrations of minorities.
Anthony Longo, CEO of the neighborhood information app CO Everywhere, believes that such services would “unintentionally redline neighborhoods,” spurring buyers and renters sorting through listings to shun areas that they might otherwise have been open to exploring.
“Now all of a sudden prices will start to change,” Longo said of home values in communities marred by negative data in the future. “And when prices start to change the whole social economy will start to change.”
Tomorrow, in Part 2 of this series, we explore how sex offender information is increasingly damaging property values and could be ghettoizing offenders.
Has neighborhood data ever made your job more difficult? Do you think hyperlocal data will impact demand for communities? Please share your thoughts in the comments section below.