There’s an overwhelming amount of data and headlines circulating. This column is my attempt to make sense of it all for you, the real estate professional, from an overall economic standpoint.
Before I start, I want to thank one of my followers, Beau Johnson from Eugene, Oregon, who reached out to me regarding the latest U.S. homeownership rate numbers. Well, I looked at the data, and it seemed to be ripe for a video discussion. (Thank you, Beau!)
Before we get going, there is one rather big caveat that I need to talk about first. I know that disclaimers generally come at the end, but this snippet is taken from the front page of the U.S. Census Bureau release on the homeownership rate in the second quarter of 2020.

In the past, the bureau relied on workers who would go out and knock on doors to see what share of the housing stock was vacant, and they would interview people who came to the door to ask if they were homeowners. But not this time.
As you’ll see shortly, this change in methodology — from personal visits to phone calls — led to some significant changes in the ownership rate. So, in as much as the report is still very worthy of discussion, we should all consider how the change in data collection may have impacted the numbers in the first and second quarters of this year.
Homeownership rates throughout history
By now, most of you will know that I generally like to take a look back in time for context, so here’s the average homeownership rate in the U.S. going back to 1890 — the first year that the census actually asked the question about whether people owned or rented their homes.

From 1890 to 1920, the homeownership rate in America fell as immigration and urbanization offset rising incomes. We did see an increase in the ownership rate during the ’20s, but the Great Depression more than wiped out this gain, with the rate falling to a low of 43.6 percent by 1940.
Between 1940 and 1960, the ownership rate rose by over 18 percent, from 43.6 to 61.9 percent. This was due to wages rising, a large share of households getting older and entering prime homebuying age, a revolution in mortgage financing, the GI Bill of Rights, and the development of large-scale housing subdivisions, which offered affordable homes.
After a slow growth from 1960 to 1980, the rate surprisingly dropped to 63.9 percent in the following decade. Part of this drop between 1980 and 1990 was due to an “under-count adjustment” that the U.S. Census Bureau implemented after the fact.
Homeownership in more recent times
Looking now at more recent times, the rate remained stable for the first few years of the ’90s but then started a remarkable trend of growth. So, what was driving this?

Here, we need to look at President Bill Clinton and his National Homeownership Strategy, which advocated a general loosening of lending standards. His plan clearly worked.
Following his tenure, President George W. Bush had his own version to continue to increase homeownership — the American Dream Downpayment Act. His plan also worked, until it didn’t.
In 2005, the homeownership rate hit an all-time high of 69.1 percent, but then the housing bubble started to deflate and then burst. This led the homeownership rate to drop to under 63 percent in 2016. That’s a number that had never been seen since the development of the quarterly ownership rate back in 1965.
Well, once we bottomed out, the rate started to improve, and that takes us to today. But what’s that on the far right of the chart, you ask?
That’s right. In the second quarter of this year, the ownership rate spiked from 65.3 percent to 67.9 percent. This rate of increase is truly remarkable and represents the largest quarterly increase on record. That’s why I opened this discussion, with the caveat that all may not actually be as it seems.
Homeownership by age
But even as we question the veracity of the data, there are still a few more interesting nuggets worthy of further discussion.

In looking at the numbers, it appears as if the greatest increase in homeownership was seen in those under 35. If you are a regular viewer — what have I been saying about millennials? This says that they might be listening! And look at that solid increases in Gen Xers too. All in all, these are extremely solid numbers.
And when we look at the year-over-year change, it’s even clearer that the pace of increase is being dominated by younger households. Brokers and builders really need to embrace this trend. It’s not going to go away, and it offers a remarkable opportunity to provide ownership housing options for our nation’s younger buyers.
Homeownership by income
So, when we look at ownership by income, the census takes a rather simple, yet effective, route by showing the ownership rate for households making above the local median income and the ownership rate for households whose earnings are below the local median.

We did see some solid growth in lower income households — possibly a function of lower interest rates as well as modestly more relaxed lending requirements. But again, I will wait to see what revisions are made down the road as the increase in lower income households was very significant.
But this data also tells me something more. As we move through the current COVID-19-impacted economy, the ownership rates of lower income households is significantly below that of households with higher incomes and, as the pandemic has had a disproportionate impact on lower-wage jobs, the likelihood of any significant growth in foreclosure activity is likely to be muted.
Homeownership by ethnicity
The census also shows the ownership rate by ethnicity, and it should make us all think. As you can see, the ownership rate for white households has been rising modestly, but has always been high. What’s far more relevant is the differential in ownership rates between white households and other ethnicities.

Although relatively high, the homeownership rate of Asian households is 14.5 percent below that of white households, and the rate for Hispanic households is 24.6 percent lower than white households. The spread in homeownership between white and Black households is 29 percent, and this is even when the ownership rate for Black households rose by 3 percent compared to the first quarter of this year.
I believe that we, as a nation, need to think about these numbers and start to find solutions to address this disparity. These significant spreads in homeownership are unacceptable, especially given the importance of homeownership for wealth-building, and narrowing racial and economic inequality.
As our nation continues to become increasingly diverse — and so do prospective homebuyers — we can’t afford to leave any growing segment of our nation behind.
What about the current homeownership rates across the U.S.?
And finally, just for fun, these are the current homeownership rates across the U.S. as well as the median home price. When we exclude Washington D.C., the lowest rate was seen in New York and the highest in Delaware. However, what’s more interesting is to contrast the ownership rate with home prices.
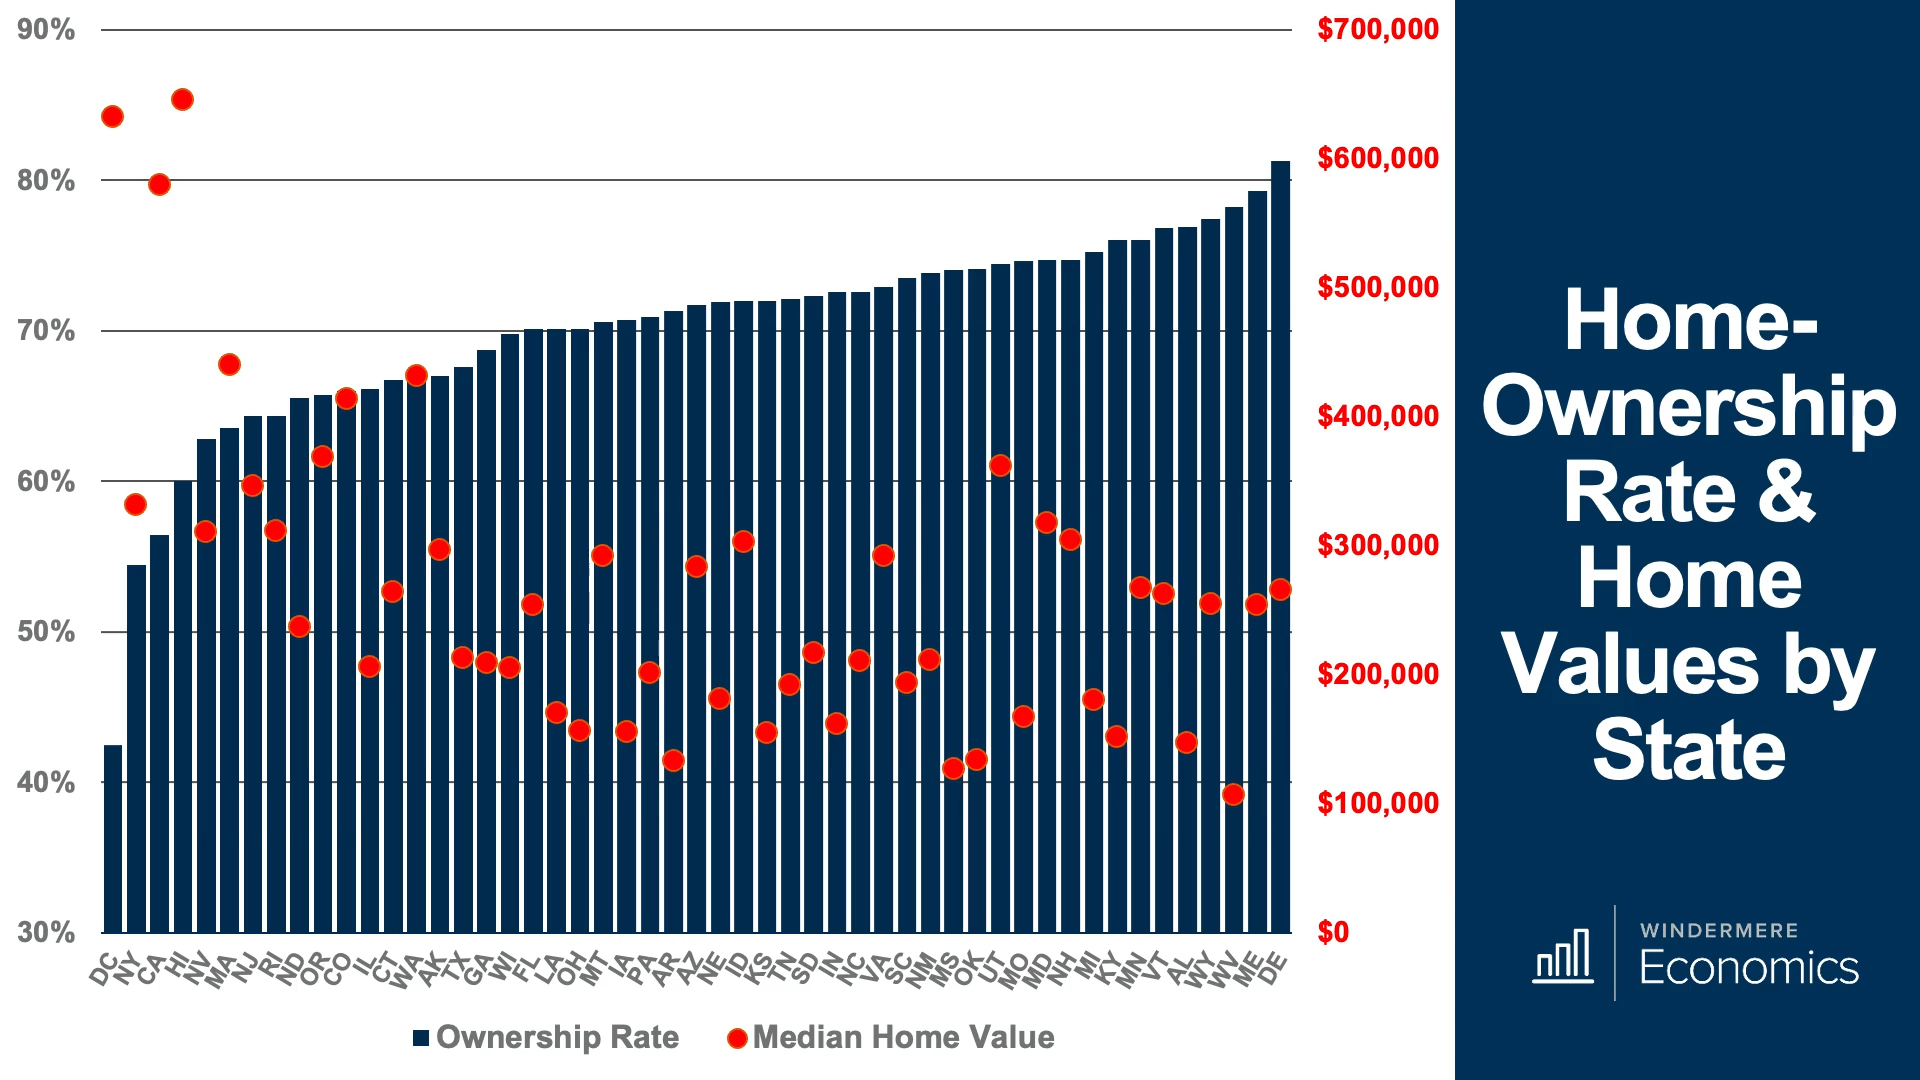
Of course, it’s logical to think that the ownership rate would be highly correlated to home values — and you do see that the ownership rate is low in expensive markets like D.C., California and Hawaii, but you will also see that this isn’t always the case.
For example, in New York and Nevada, the ownership rates are 54.4 percent and 62.8 percent respectively. However, home prices in both markets are in the low $300,000 range.
But things make more sense at the other end of the spectrum, with very high ownership rates seen in Delaware, West Virginia, Alabama and others states where home values range from the low $100,000’s to the mid-$200,000’s.
So, there we have it. On the face of it, the headline number was quite remarkable, with a very significant increase in the ownership rate, but we should be cautious about relying on it given the change in methodology.
Matthew Gardner is the chief economist for Windermere Real Estate, the second largest regional real estate company in the nation.