North Carolinians who doubt that iBuyers could gain much traction might change their tune if they take a look at a new “iBuyer Map.”
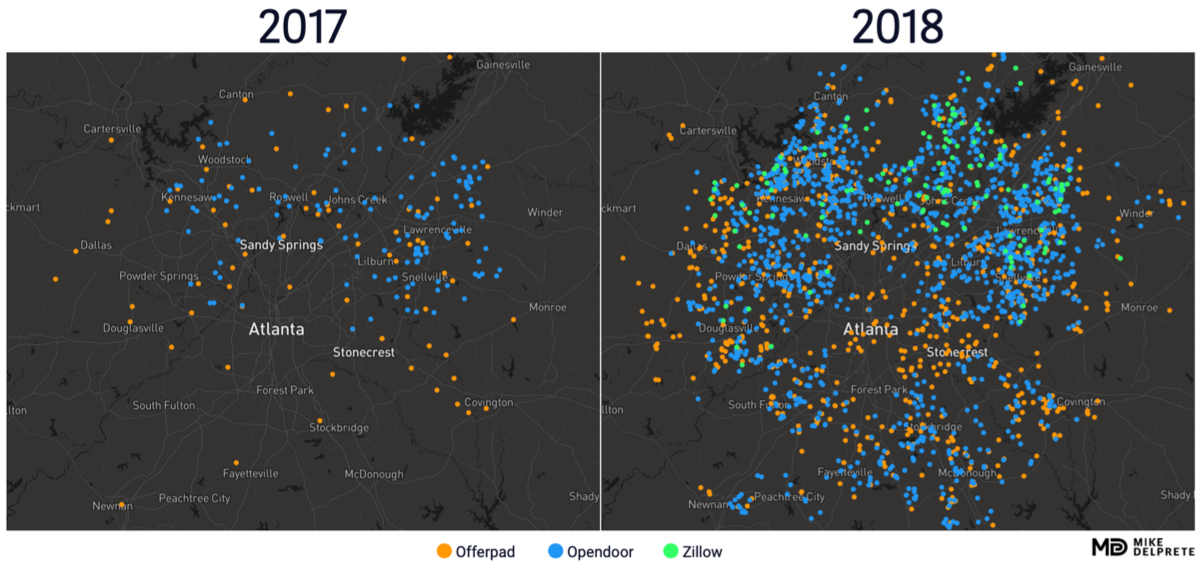
Dots representing home purchases by Opendoor and Offerpad explode from 2017 to 2018, showing break-neck growth over the span of a year.

Mike DelPrete
“It basically goes from nothing to this virus that’s spread everywhere,” said Mike DelPrete, a real estate tech analyst.
DelPrete launched the map today in partnership with Remine, a real estate data and software provider. The interactive visualization tool offers a way for observers to closely track iBuyer growth and trends, subjecting the three category leaders — Opendoor, Zillow Offers and Offerpad — to a level of transparency that is unusual for many venture capital-funded companies.
The data, which covers 2016 to June 2019, comes from public property records aggregated by Remine. The records are matched to more than 100 entities that iBuyers use to purchase homes across more than 20 markets, according to DelPrete.
DelPrete says he checks the accuracy of the numbers with all three iBuyers covered by the map.
“They’ve been really good at having conversations with me where we can kind of open the kimono together and take a look at some stuff, and it remains confidential, but it helps confirm certain assumptions I can make from looking at public data,” he said.
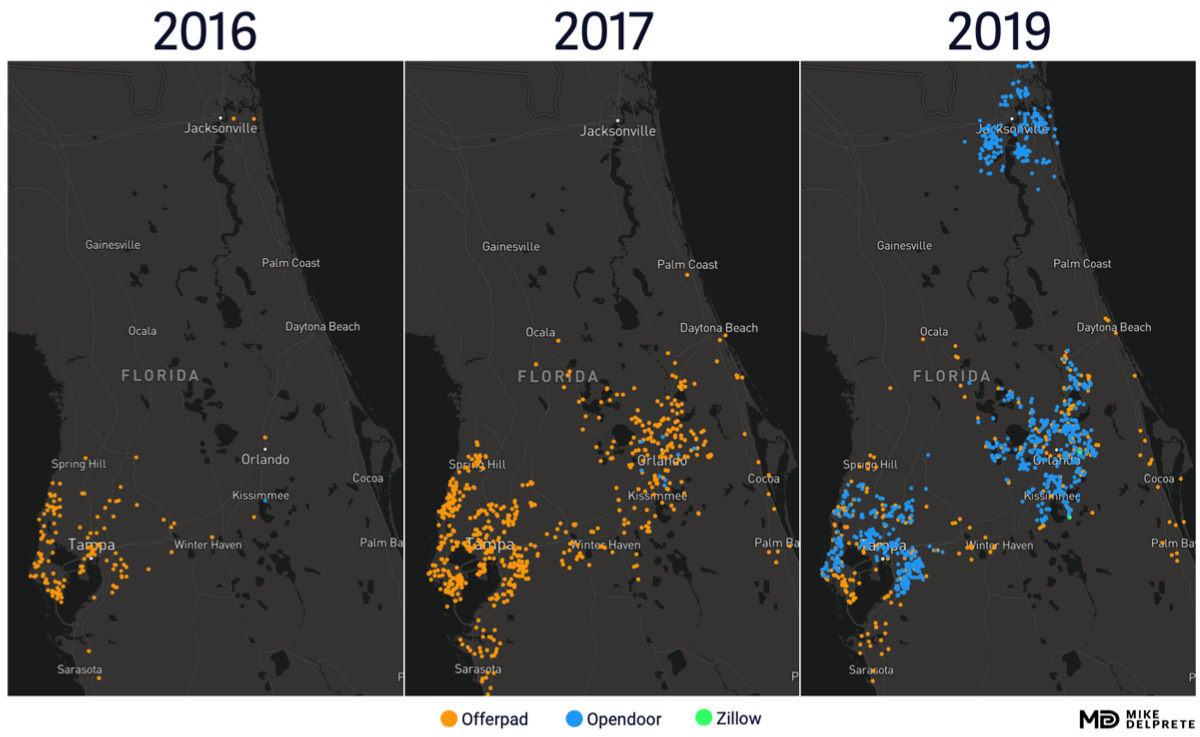
Toggling between different years and markets tells stories of expansion and war.
Visualizations of Atlanta, for example, offer one of the starkest pictures of iBuyer growth. A smattering of orange (Offerpad) and blue dots (Opendoor) in 2017 turns into an explosion of orange, blue and green (Zillow) in 2018.
One theme is Opendoor’s clear lead over competitors.
In the first six months of this year, Opendoor had racked up around 9,830 home purchases, compared to 10,370 for all of 2018, according to data that underpins the map and was provided to Inman by DelPrete.
By comparison, Zillow clocked around 2,990 for the first half of the year, up from roughly 620 for all of 2018. And Offerpad closed about 1,790 purchases for the first half of the year, compared to 3,250 for all of 2018.
The map also suggests that Opendoor appears to have displaced Offerpad in a number of markets over the past year, including in Florida and Southern California.
Another mega trend is what DelPrete calls “the green monster” — the rapid growth of Zillow Offers after its launch in 2018.
A burst of green dots in Phoenix, for example, show Zillow’s home purchases jumped from about 350 for all of 2018 to roughly 730 for only the first six months of this year. (Opendoor bought nearly 1,970 homes in Phoenix during the same period.)
The national iBuyer purchase data DelPrete provided to Inman (cited above) suggests that Zillow Offers was on pace halfway through the year to buy nearly 10 times as many homes as it did in 2018 while Opendoor looked set to double its purchases.
Another takeaway is that Zillow appears to be willing to push the pedal to the metal even harder than Opendoor.
Both iBuyers launched in Denver at about the same time, in October 2018 — each notching less than 30 purchases for the year. But in the first six months of 2019, Zillow had bought about 340 homes, compared to Opendoor’s 260, according to DelPrete’s data.
The launch of the map points to how iBuyers are destined to come under a level of scrutiny that isn’t possible with most privately held companies.
“With other private companies, you’re reliant on the company itself to tell you what it wants to tell you and how it wants to tell you,” DelPrete said.
But property sales records are generally public. That means analysts will look at those records to try to measure iBuyer activity.
How that data is interpreted may or may not rub iBuyers the right way. A recent study’s finding that iBuyers typically cost between 13-15 percent of the value of a home — based on public sales data — was probably not music to their ears.