
Home prices rose in 78 percent of U.S. metro areas during the third quarter, while pending sales in the four weeks ending Oct. 25 fell to the lowest level in Redfin’s records.
The national median single-family existing-home price rose 1.7 percent year over year to $432,900, matching the second quarter’s revised annual growth rate, the National Association of Realtors reported Thursday. Prices rose in 78 percent of the some 235 metros NAR tracks, down from 80 percent in the second quarter, and fell in 21 percent, up from 20 percent. Four percent of metros posted double-digit gains, down from 5 percent.
“Even with affordability challenges causing the housing market to stagnate, home prices continue to set record highs in most parts of the country,” NAR Chief Economist Lawrence Yun said in a statement. “Homeowners are the beneficiaries of the price gains. Over the past seven years, the average house has appreciated by $146,000.”
Redfin’s data for the four weeks ending Oct. 25 shows prices dipping. The median U.S. home-sale price fell 0.1 percent year over year to $389,601, according to Redfin, following a 0.2 percent decline the prior week. The two drops are the first in more than three years.
NAR and Redfin measure different things. NAR tracks quarterly sales of existing single-family homes, while Redfin’s figures cover homes listed or sold across more than 900 metros on a rolling four-week basis.
Regional prices
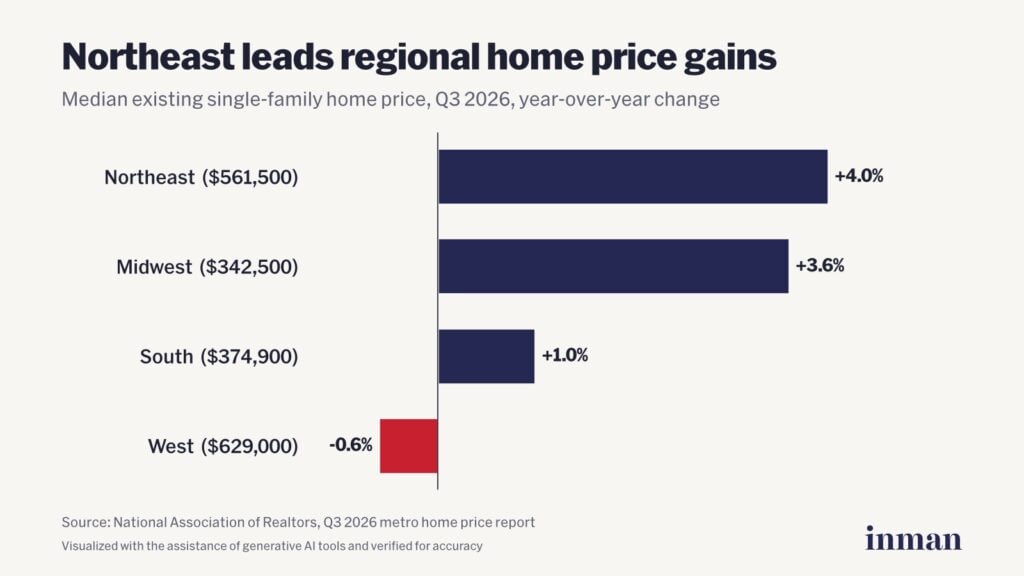
The Northeast posted the largest annual gain, and the West was the only region where prices fell, according to NAR.
- Northeast: $561,500, up 4 percent
- Midwest: $342,500, up 3.6 percent
- South: $374,900, up 1 percent
- West: $629,000, down 0.6 percent
Prices declined in many Florida markets over the past year, Yun said.
“This quarter, however, homes in nearly all Florida markets are showing price gains,” he said. “In a similar vein, price declines in other markets may also be brief if the local job market and economy are solid.”
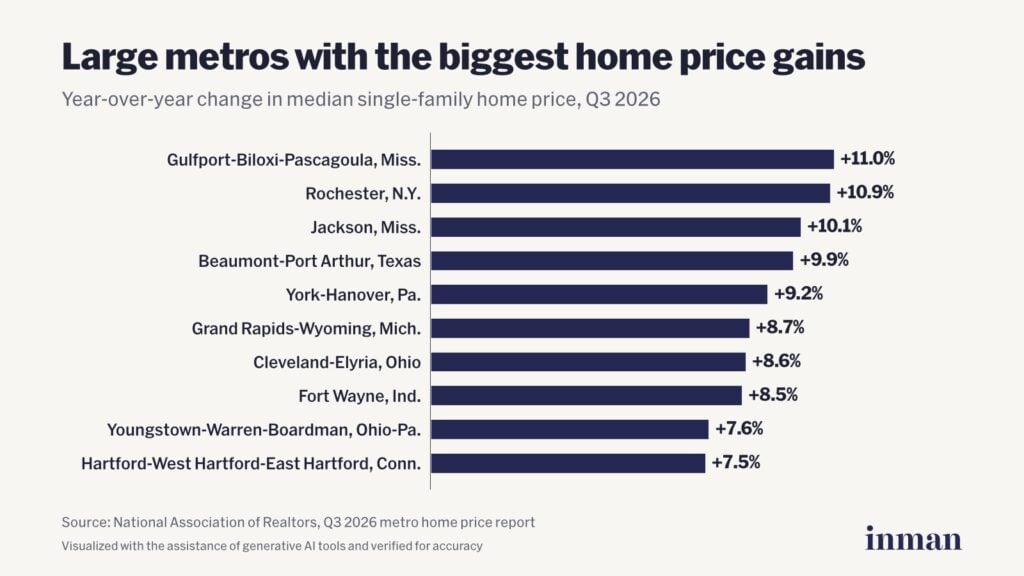
Gulfport-Biloxi-Pascagoula, Mississippi, led large markets with an 11 percent price increase, followed by Rochester, New York (10.9 percent) and Jackson, Mississippi (10.1 percent). Grand Rapids-Wyoming, Michigan; Cleveland-Elyria, Ohio; and Fort Wayne, Indiana, were among the Midwest markets in the top 10.
“Many markets in the Midwest offer exceptional value with more affordable homes, making homeownership more attainable,” Yun said. “Meanwhile, the artificial intelligence technology boom continues to push Bay Area home prices higher, keeping the region the most expensive in the country.”
San Jose-Sunnyvale-Santa Clara, California, remained the most expensive market at a median of $1.92 million, up 0.3 percent. Anaheim-Santa Ana-Irvine, California ($1.47 million) and San Francisco-Oakland-Hayward, California ($1.35 million) followed. Nine of the 10 most expensive markets are in California or Hawaii.
Affordability
The monthly mortgage payment on a typical existing single-family home with a 20 percent down payment was $2,251 in the third quarter, up $48 from the second quarter and $69 from a year earlier, according to NAR. Typical families spent an average of 24.1 percent of income on mortgage payments, up from 23.9 percent last quarter and down from 24.5 percent a year ago.
First-time buyers faced a monthly payment of $2,208 on a typical $368,000 starter home with 10 percent down. That payment took up 36.3 percent of income, up from 36 percent last quarter and down from 37 percent a year earlier.
Pending sales hit a low in Redfin’s records
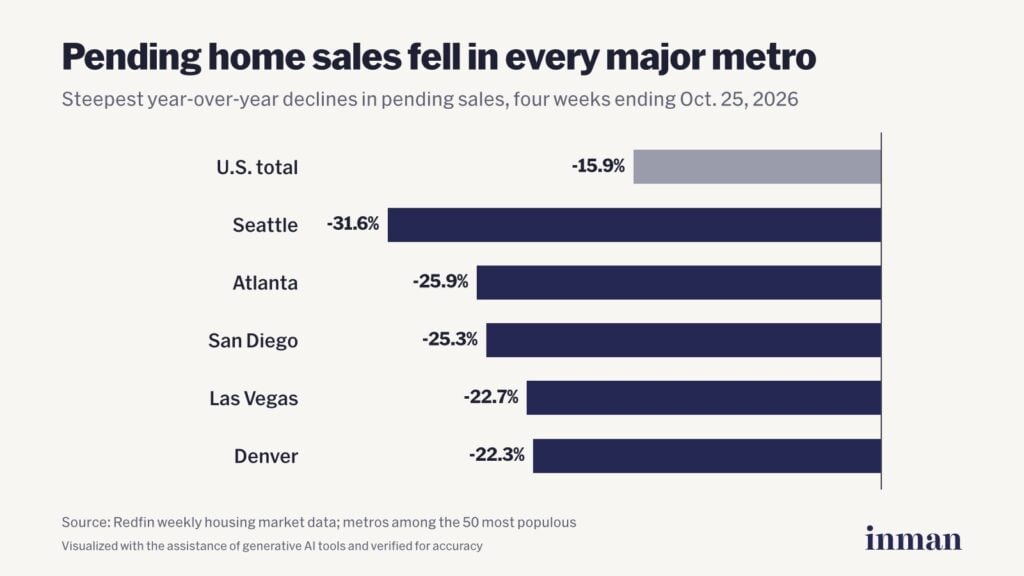
Pending sales fell 1.8 percent from a week earlier and 15.9 percent year over year, declining in all 50 of the most populous U.S. metros for the third straight week, according to Redfin. Seattle (down 31.6 percent) and Atlanta (down 25.9 percent) posted the steepest annual drops.
Redfin’s median monthly mortgage payment, calculated at a 7.32 percent rate, reached $2,786, up 10.7 percent year over year and the second-highest level in its records. The weekly average rate is down from 7.4 percent a week earlier and near a three-year high.
New listings fell 0.6 percent from a week earlier to their lowest level since January. Total inventory rose 0.3 percent because pending sales fell faster than new listings, Redfin reported. The share of listings with price drops rose to 21.5 percent from 20.9 percent a year earlier.
Redfin reported hundreds of thousands more sellers than buyers nationwide, giving buyers more negotiating power than they have had in more than a decade.
Rates and prices
A First American analysis found that since 1991, rising mortgage rates have coincided with falling national home prices in some cases. In eight periods of sustained mortgage-rate increases since 1993, national home prices generally continued to appreciate, though the pace varied, First American Chief Economist Mark Fleming found.
During the rate run-up from December 2021 through October 2023, national prices rose an estimated 14 percent, according to the analysis. Affordability worsened at a steeper rate than prices, Fleming found. First American’s Real House Price Index, which adjusts prices for changes in income and mortgage rates, rose more than 70 percent over the same period.
Limited inventory can offset weaker demand when rates rise, Fleming wrote. Homeowners with mortgages below current rates may hold off on selling, and some sellers pull homes from the market rather than accept lower prices.
“Higher mortgage rates can put pressure on home prices, but the economy, household incomes and the number of homes for sale all play a role in what happens next,” Fleming wrote.